The Advanced Charting Tool allows you to overlay a study on top of the main price graph or over another study. See instructions below:
How to overlay a Study on a Price chart
- Navigate to the Advanced Charting Tool (Tools > Advanced Charting)
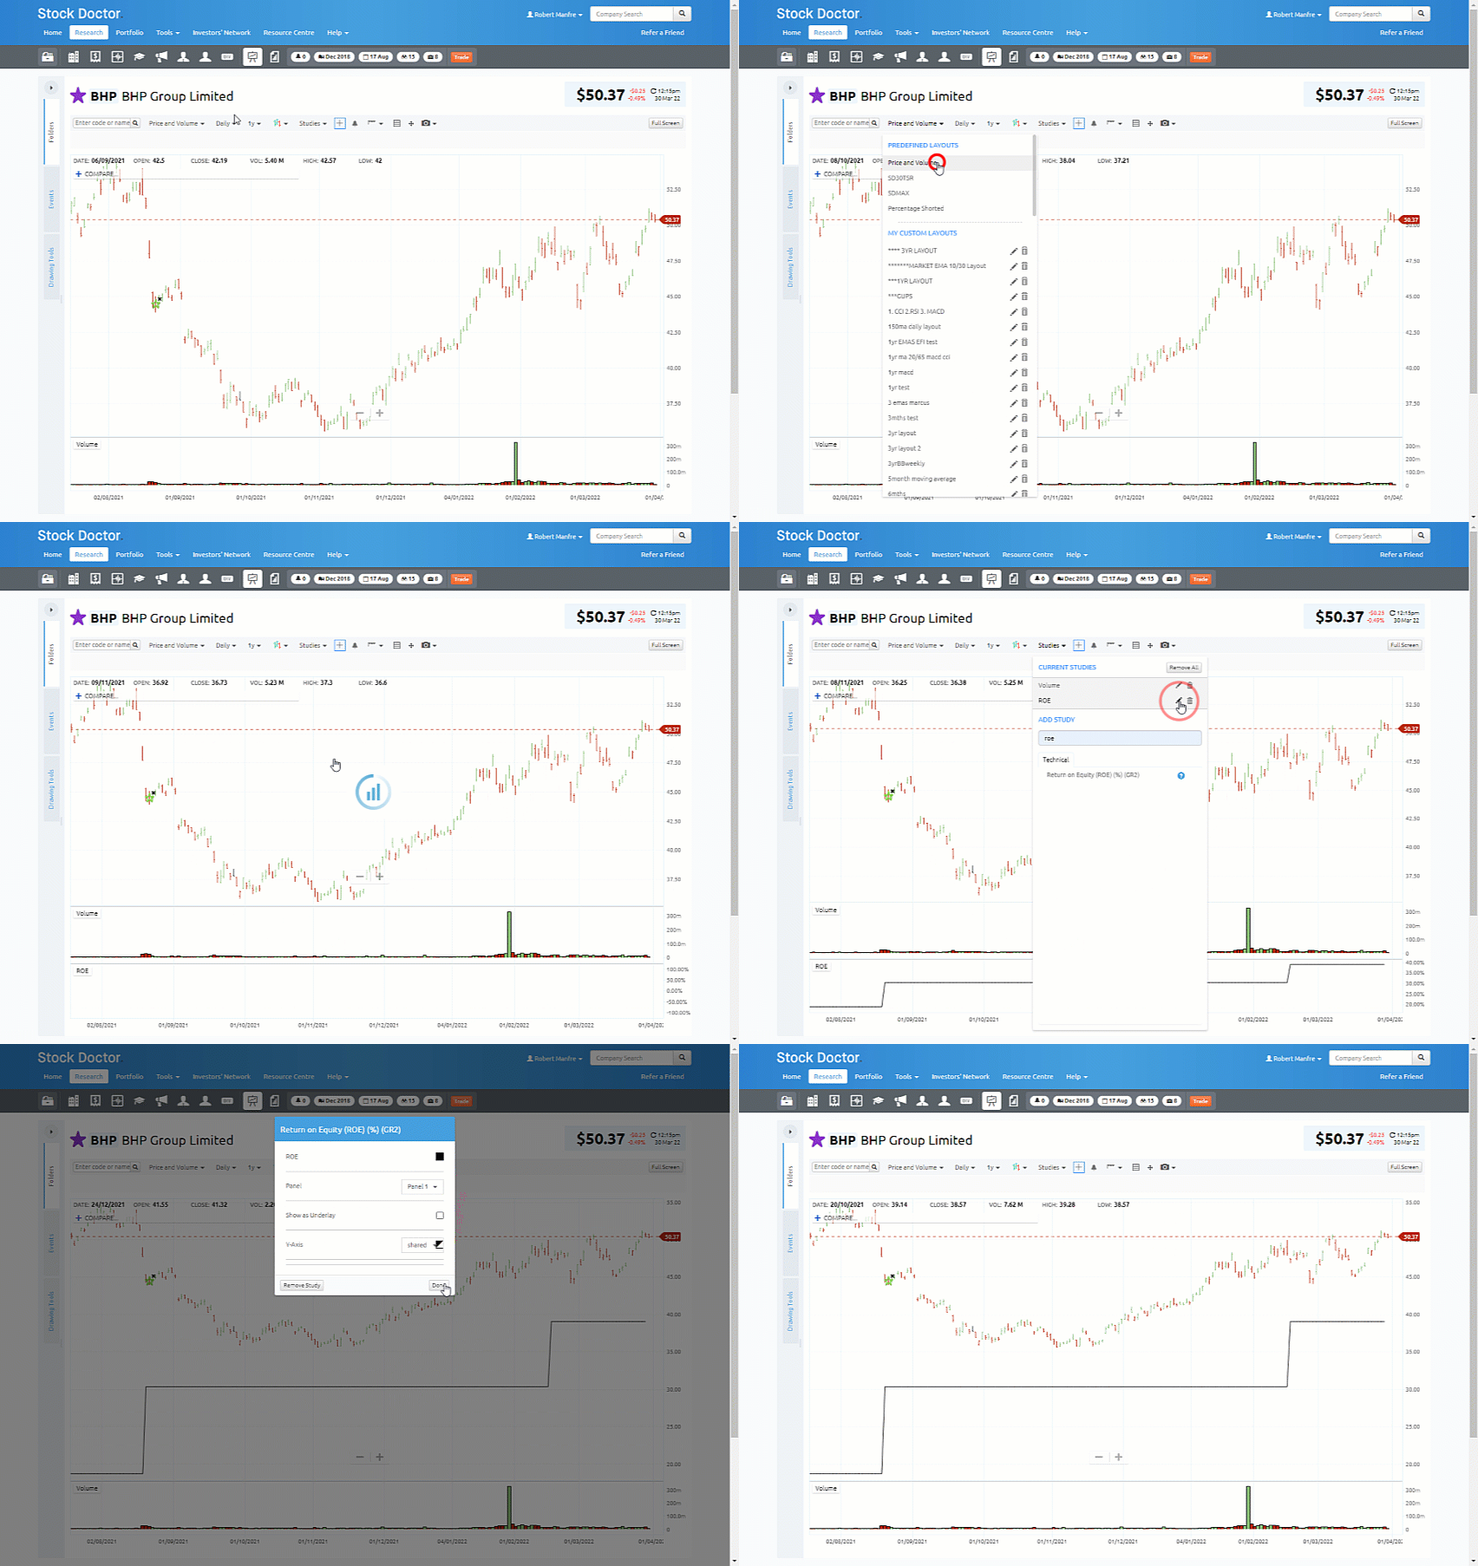
- In this example we will begin with a blank canvas by selecting Price and Volume from the Templates menu.
- Next, Click Studies and select a study from the drop down menu. e.g. ROE
- ROE will now be applied as a panel to the bottom of the chart (by default) in this case (Panel 3).
Now, to move/overlay this study (ROE) on top of the main price chart (Panel 1)
- Click on the Studies drop down menu again
- Under the Current Studies section.
- Click on the pencil icon along side ROE and a properties box will appear
- In the Panel row, Click on the drop-down menu, and change it to Panel 1 (Main price chart)
- Click Done

How to overlay a Study on top of another Study
- Navigate to the Advanced Charting Tool (Tools > Advanced Charting)
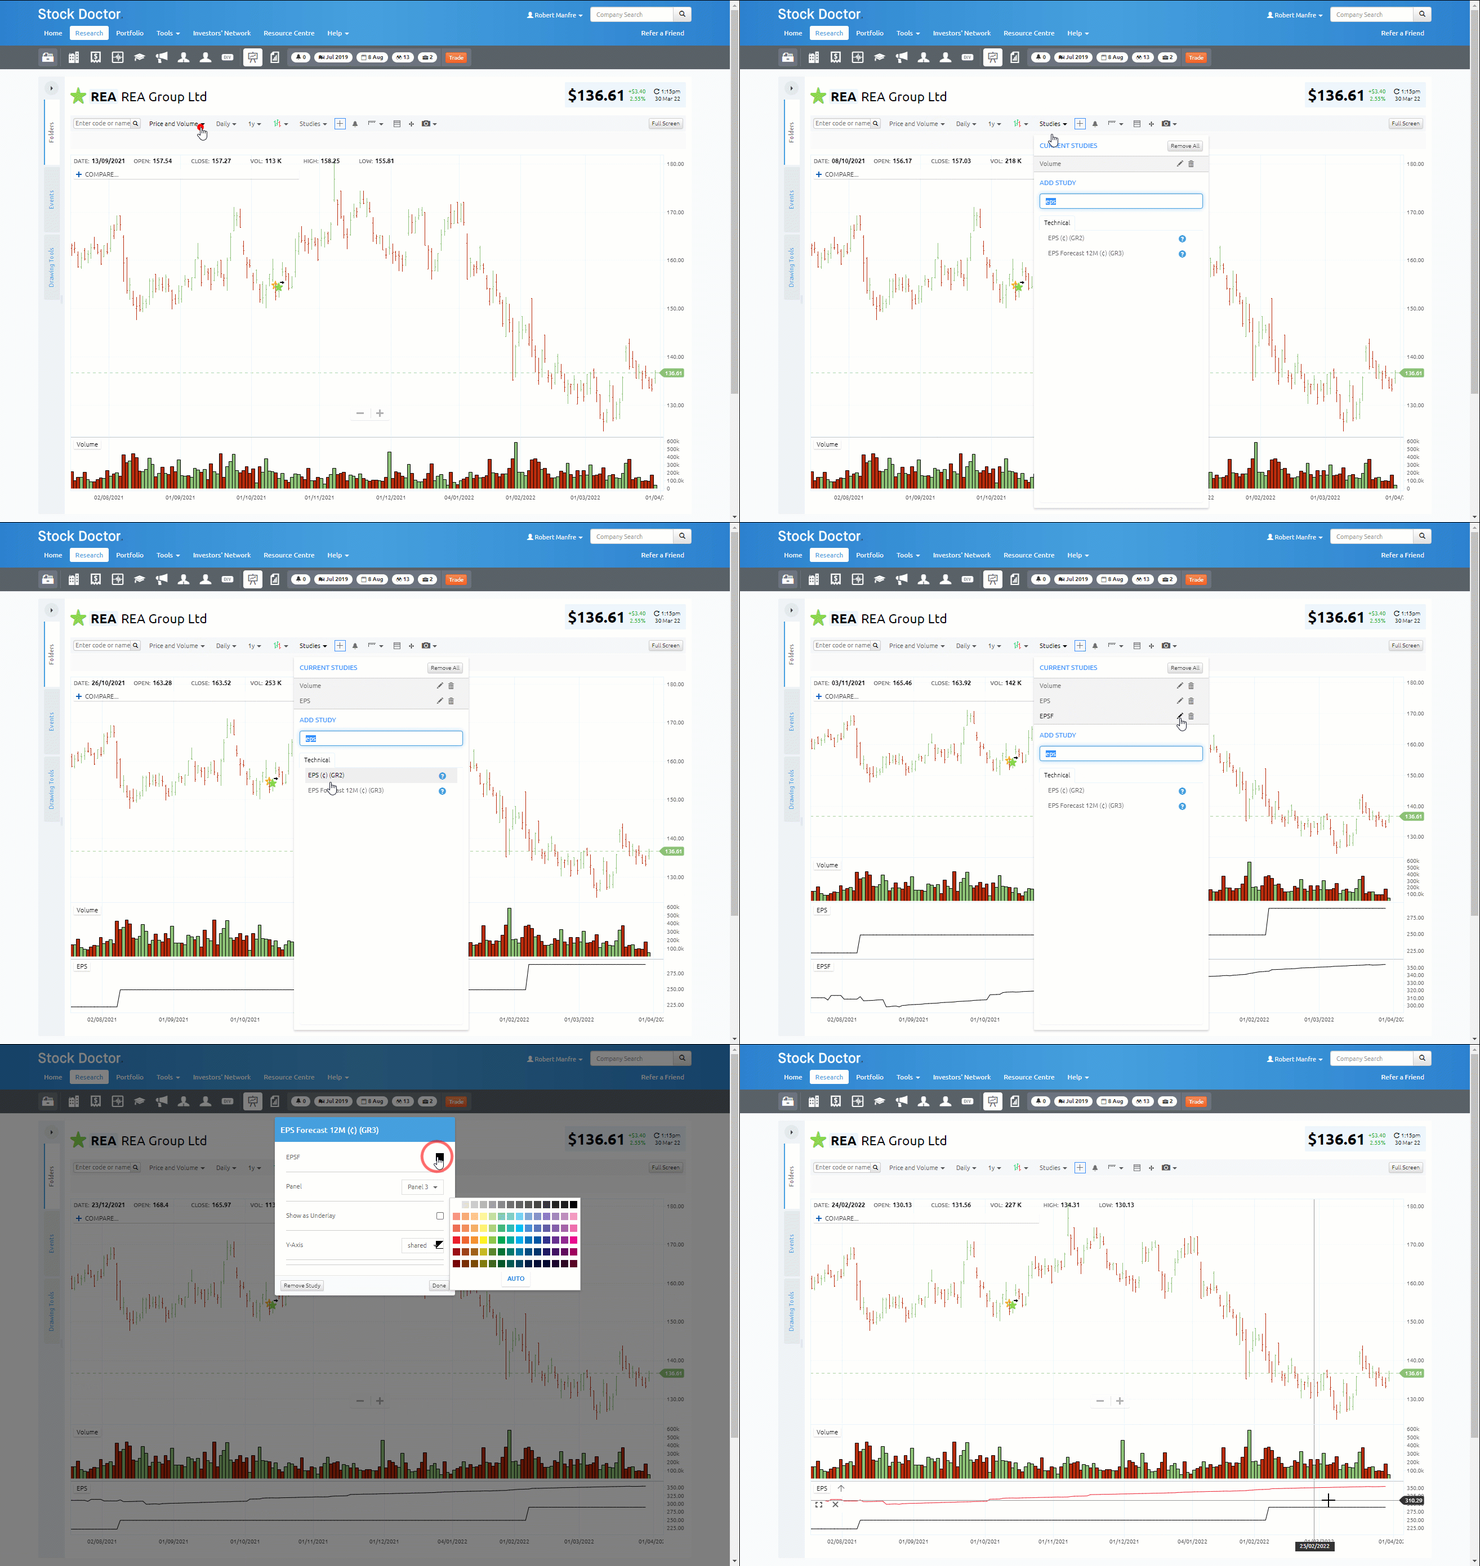
- In this example we will begin with a blank canvas by selecting Price and Volume from the Templates menu.
- Next, Click Studies and select a study from the drop down menu. e.g. EPS
- EPS will now be applied as a panel to the bottom of the chart in this case (Panel 3).
- Next, Click Studies and select another study from the drop down menu. e.g. EPS Forecast 12M
- EPS Forecast 12M will now be applied as a panel to the bottom of the chart in this case (Panel 4).
Now, to move/overlay EPS Forecast 12M (Panel 4) on top of EPS (Panel 3)
- Click on the Studies drop down menu again
- Under the Current Studies section.
- Click on the pencil icon along side EPS Forecast 12M (EPSF) and a properties box will appear.
- In the Panel row, Click on the drop-down menu, and change it to Panel 3 (EPS)
- Next, click on the colour palette alongside EPSF and change the line to red (this will allow you to easy differentiate between the 2 line).
- Click Done
