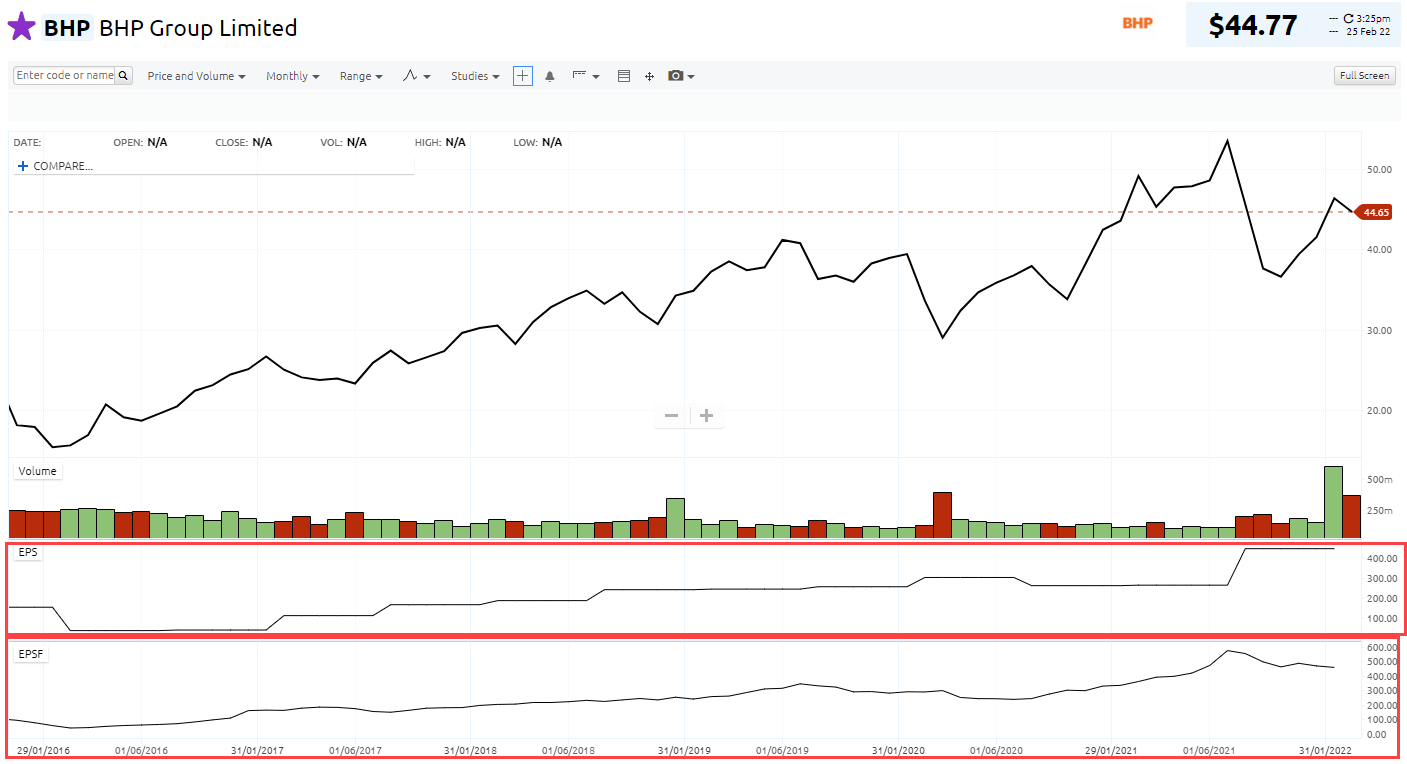
EPS stands for Earnings per share
EPSF stands for Earnings per share forecast 12 months.
Indicator Type
Financial Indicators
Formula
EPS = Net profit after tax / number of shares on issue
EPS forecast 12M = Forecast EPS for a date 12 months into the future. This is interpolated from the consensus analyst EPS forecasts for the next 2 periods.
Parameters

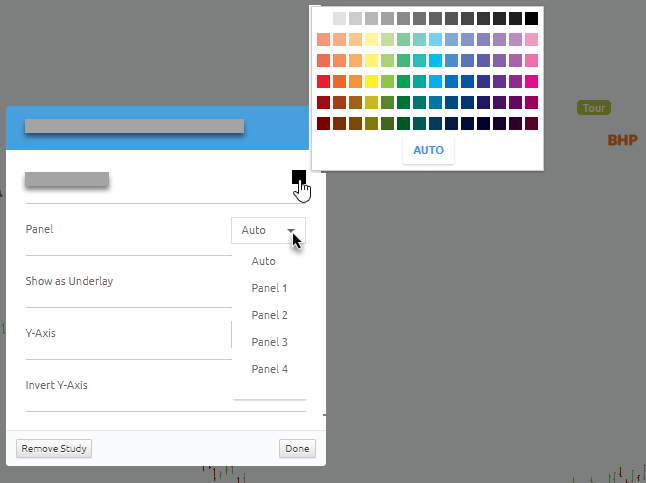
EPS and EPSF: You can choose a colour for the plot, by selecting the box next to it to bring up a colour palette.
Panel: You can also choose where the study is placed, by default it is set to Auto applying it to it own panel at the bottom of the chart but if you would like to overlay the study onto another panel, click the drop-down arrow next to Auto and select a panel e.g. Panel 1.
Once you have finished adjusting parameters, click Done
Theory
Earnings per share (EPS) reflects how much profit a company has made or is forecast to make for each share of its stock. EPS is a widely used metric for estimating corporate value. Empirical studies have found a positive correlation between up-trending EPS revisions and positive share price performance.
EPS Forecast 12M (EPSF) refers to the median consensus forecast of a company’s earnings per share on a rolling basis over the next 12 months. In other words, the value is interpolated over the next two periods so that it represents an exact point in time 12 months into the future from the current date.
The reason this is done is to avoid abrupt jumps in the 12M forecast EPS once the financial year changes. Also, it allows for a consistent comparison between companies especially when they have different financial year periods.
Short and sharp elevations/descents to the 12M forecast EPS trendline implies that the stock has experience earnings upgrades or downgrades over that period. This usually occurs following a company announcement. Forecast upgrades imply positive sentiment, whereas downgrades usually lead to negative share price sentiment.
Growth stocks tend to exhibit an up-trending EPS pattern over the long term, which reflects the increase in profitability over time. A positive trend in EPS forecasts may help you to identify dynamic growth stocks.