Overview:
Following member feedback, Lincoln Indicators launched its technical indicator, SDMAX in 2018. When applied to Star Stocks, SDMAX combines both fundamental and technical analysis to assist in buy/sell decision making. Following further back-testing on Star Stock performance, the indicator was revised in 2020.
Stock Doctor’s 20/65-day High/Low Simple Moving Average crossover indicator, identifies strong Bullish and Bearish trends to assist with entering and exiting a stock using visual and definitive signals.

This Indicator is suitable for investors who are highly sensitive to price declines and are willing to take a more proactive approach to portfolio management. The active nature of this strategy has the potential to increase churn – which may result in higher transaction costs or taxation. Investors who adopt this strategy are generally those who wish to capture an up-trending Star Stock, but are keen to limit the downside when the price trend reverts.
This Indicator displays the following moving averages:
- Slow (65 days) simple moving average of the high and low price
- Fast (20 days) simple moving average of the high and low price

How to apply:
Investors using this Indicator look for the Bullish and Bearish crossover points (both lines must cross each other) to determine when to enter and exit the stock.
The Entry trigger occurs when both fast moving averages cross above both slow moving averages. When the fast moving average of the low is above the slow moving average of the high, the stock price is considered Bullish (i.e. in an uptrend). This is indicated by a shaded (Green Bullish zone) on the chart.

The stock remains Bullish until the Sell trigger occurs, which is when both fast-moving averages cross below both slow moving averages. When the fast moving average of the high crosses below the slow moving average of the low, the stock price is considered Bearish (i.e. in a downtrend). This is indicated by a shaded (Bearish red zone) on the chart.
Pro’s
- Suits those who are highly sensitive to drawdowns in their stocks.
- Limits significant price declines (drawdowns) as long as the share price movement is not too rapid.
- Helps investors identify major trends in share prices
- The use of two moving average channels allows for less fewer signals than using one moving average channel.
Con’s
- Investors should be aware that moving averages are lagging indicators and will not perform well when share prices move significantly in a short space of time e.g. in a V-shaped market decline and recovery.
- Signals are generated more frequently than other strategies (ie SD30TSR, non-rebalanced portfolios) and this will mean increasd stock churn and transactions costs.
- The strategy could whip-saw in and out of positions, which may lead to more frequent crystallisation of losses or gains.
- Due to the lagging nature of this indicator, investors may need to buy the stocks at higher prices than they sold.
Utilising this Indicator does not guarantee you will avoid all losses, reduce your losses or achieve improved investment performance. The Indicator is an indication only of stock trends and is not a prediction of future outcomes.
Accessibility
9 Golden Rules Screen
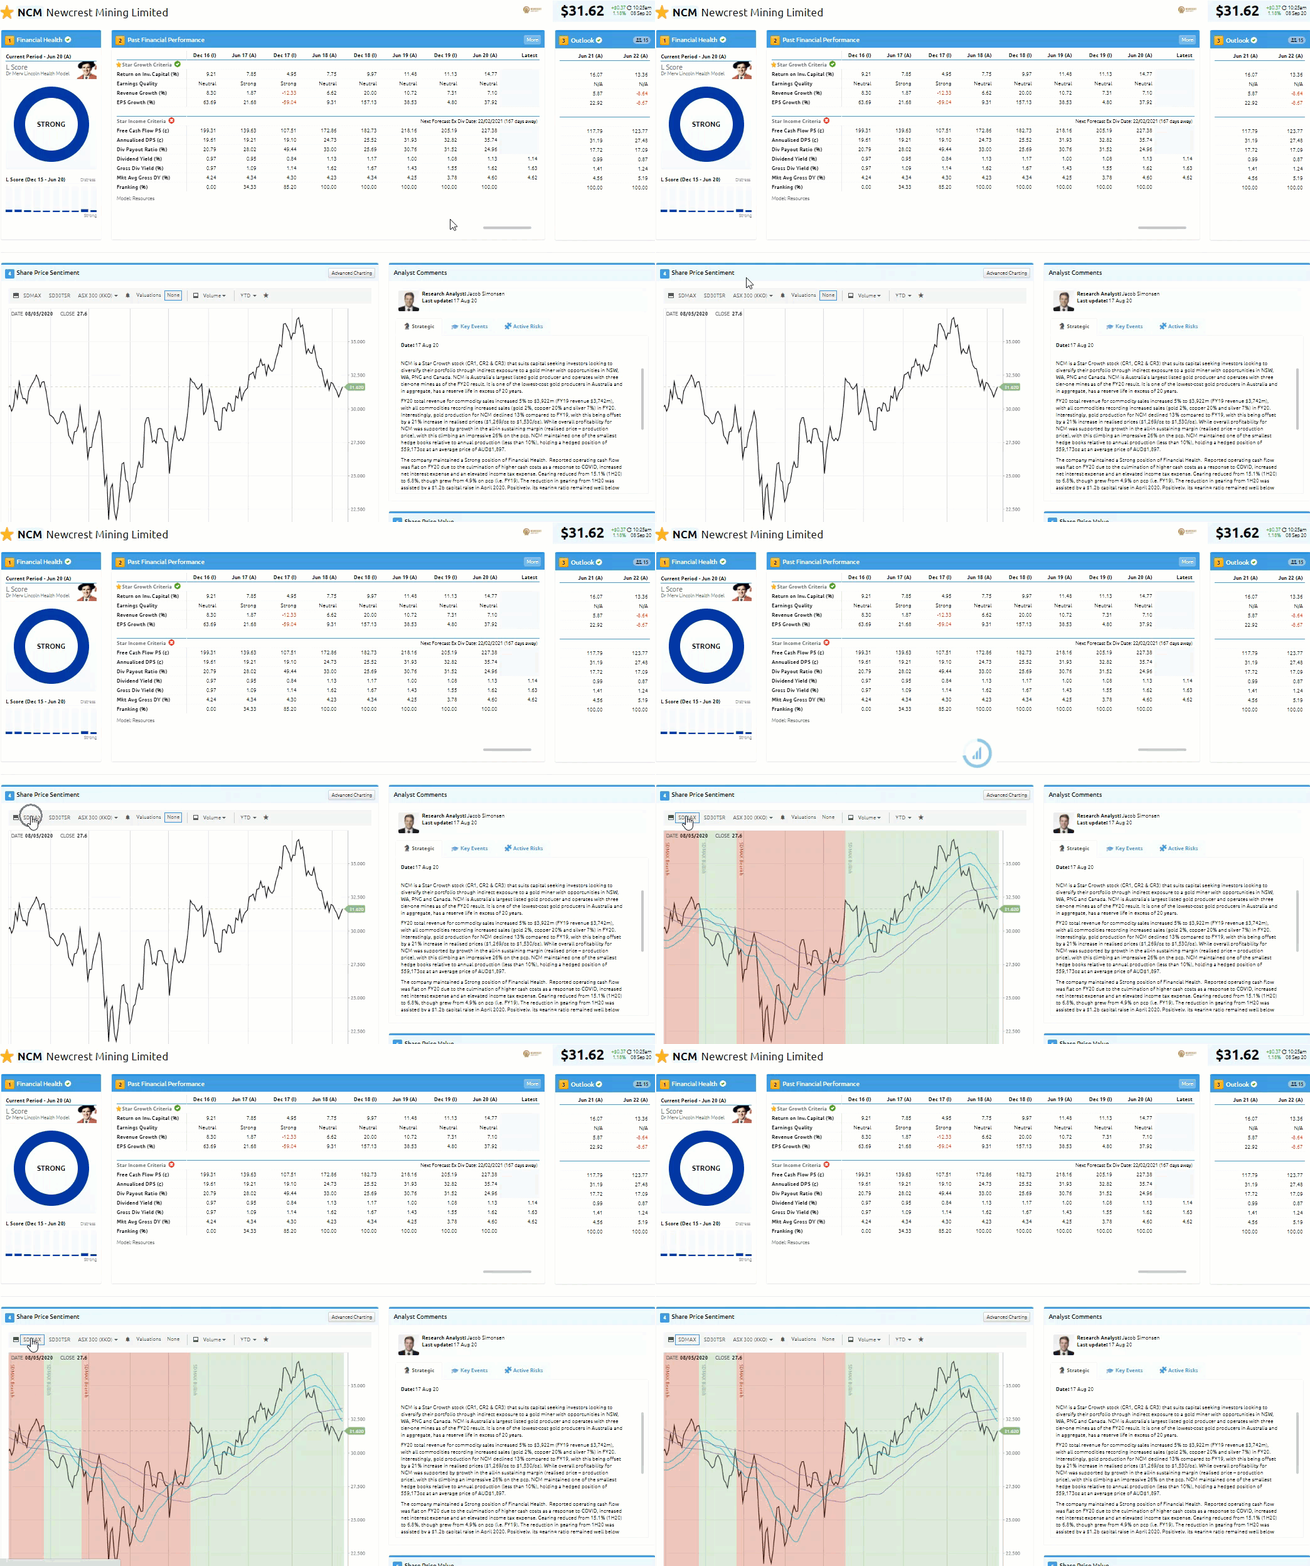
SDMAX is accessible via the 9 Golden Rules page under Golden Rule 4 via the top menu.
- Navigate to any company 9 Golden Rule screen
- Under Golden Rule 4
- Click the SDMAX button
Advanced Charting Tool
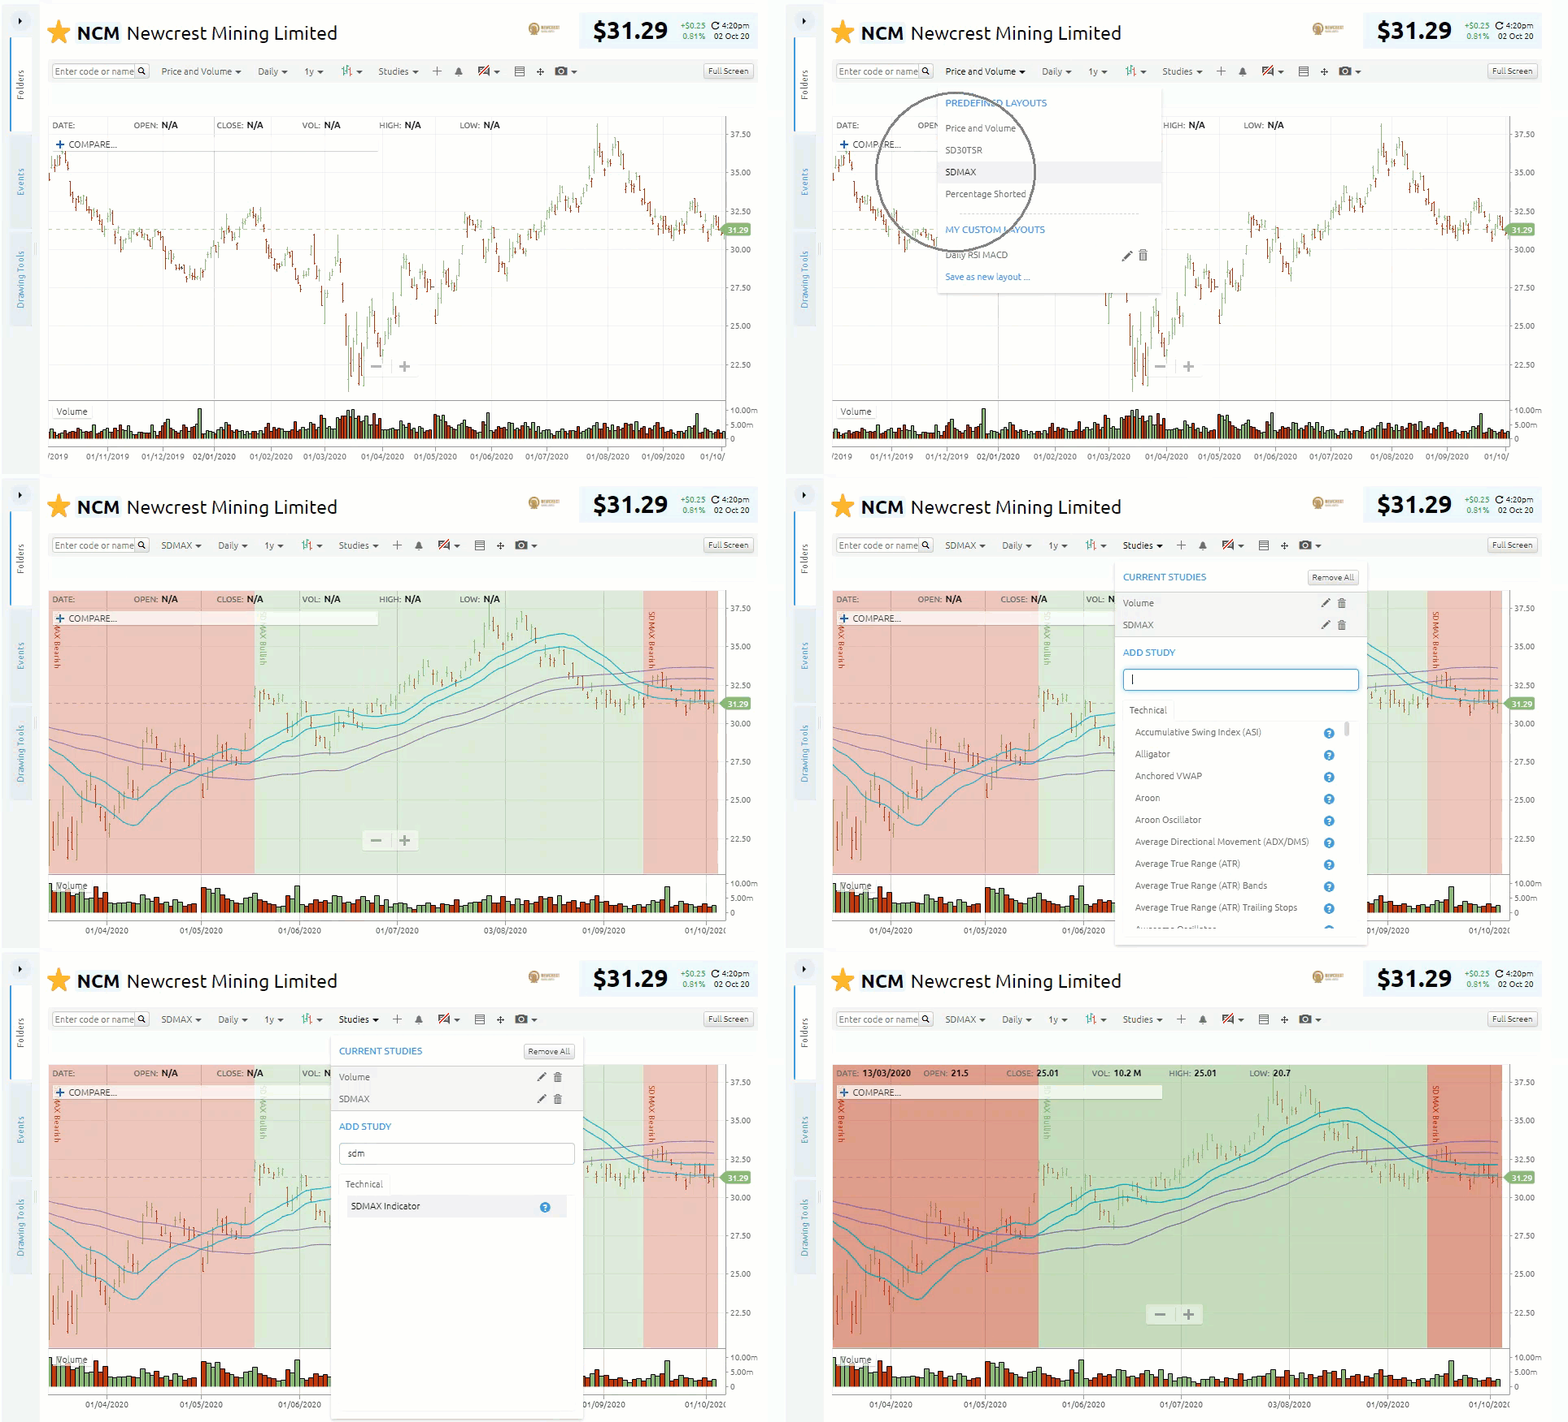
You can apply SDMAX in the Advanced Charting Tool. Select it from the Layouts Menu or the Studies drop-down menu.
- Navigate to the Advanced charting tool (Tools > Advanced Charting Tool)
- Click on the Layout down menu
- Select SDMAX
OR - Click Studies
- Select SDMAX Indicator
Alerts
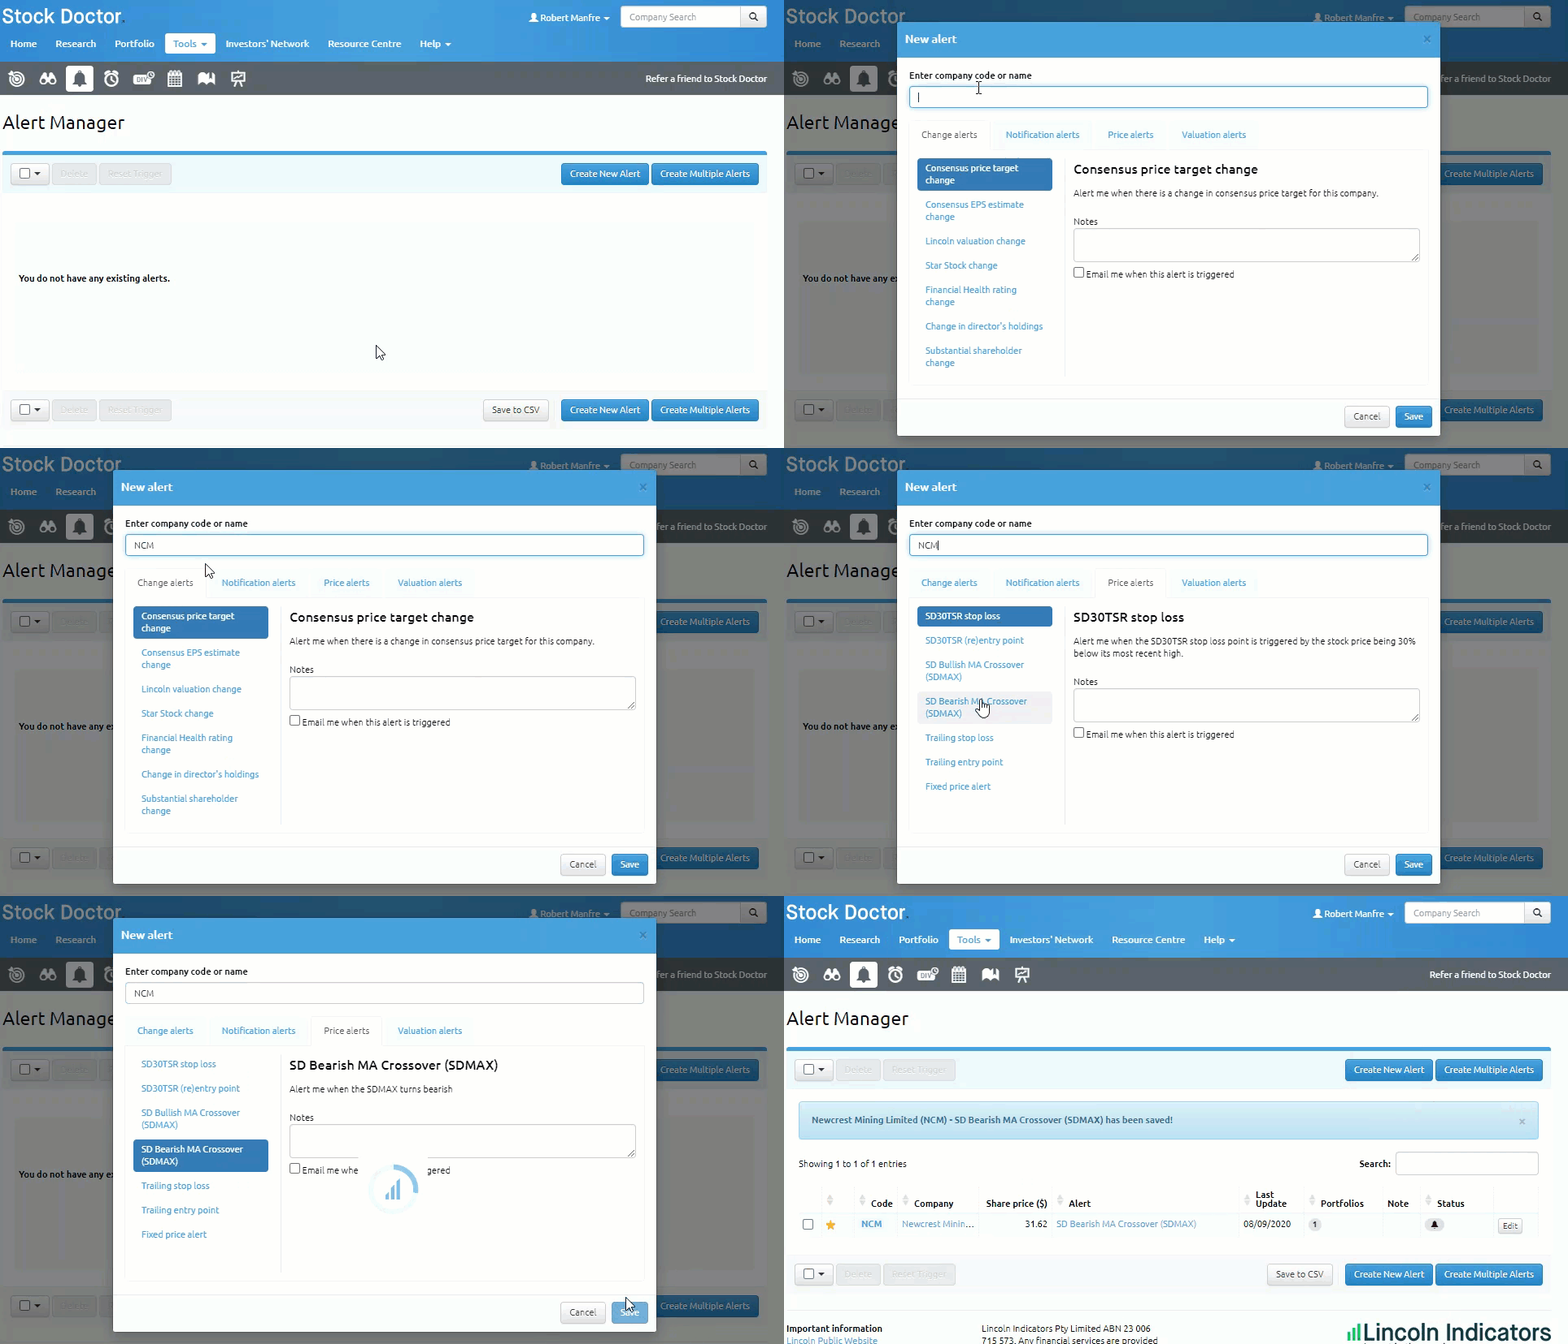
Use Alerts to let you know when the SDMAX trend changes from Bullish to Bearish and vice versa.
- Navigate to the Alert Manager (Tools > Alert Manager)
- Click Create New Alert
- Enter company code
- Select Price Alerts Tab
- Select either SD Bullish MA Crossover (SDMAX) or SD Bearish MA Crossover (SDMAX).
- Optional: Tick ‘email me if this alert is triggered’.
- Select Save
Stock Filter
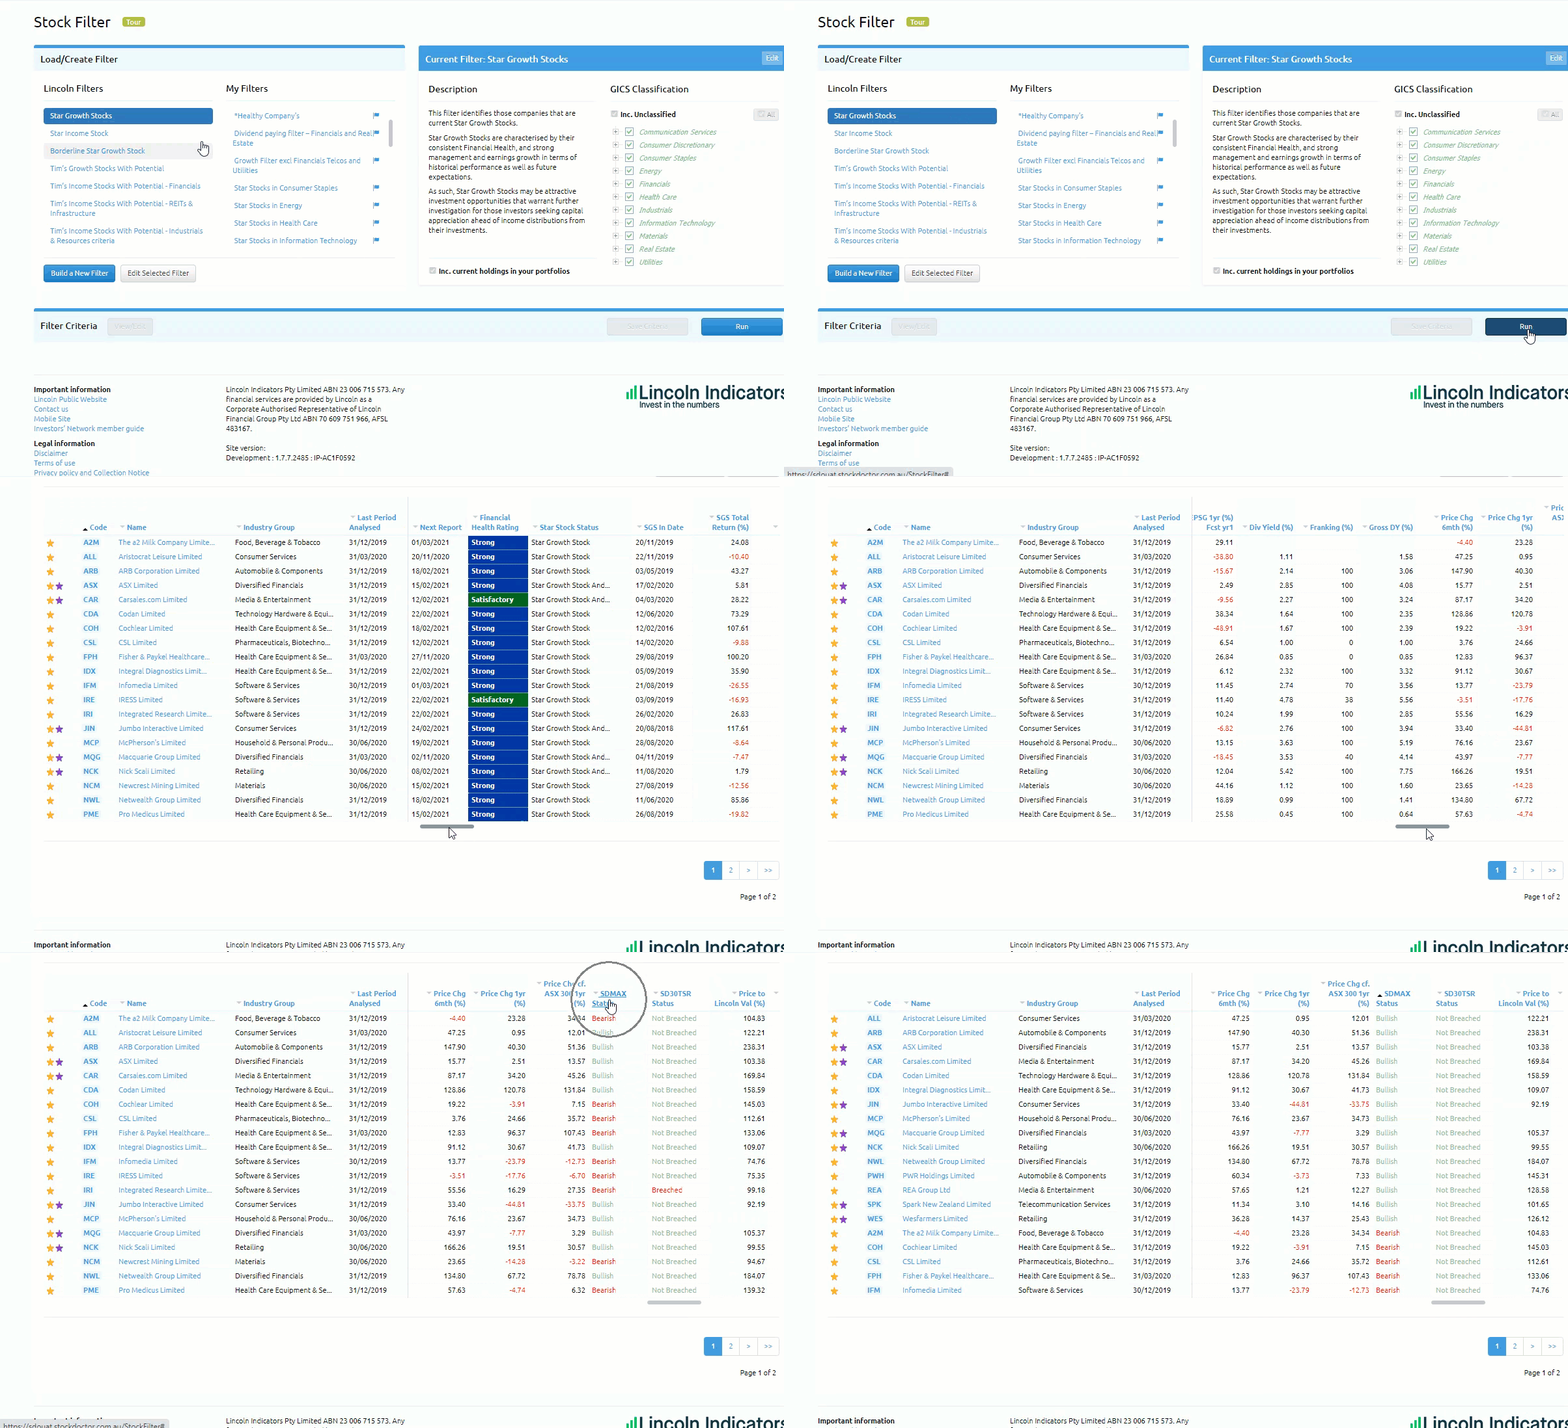
SDMAX is incorporated into the existing Star Stock filters. Simply, select one of Lincoln’s Star Stock Filters, then click ‘Run’.
- Navigate to the Stock Filter (Tools > Stock Filter)
- Click on an existing Lincoln Star Stock Filter
- Click Run
- Scroll to the far right of results: SDMAX Status column.
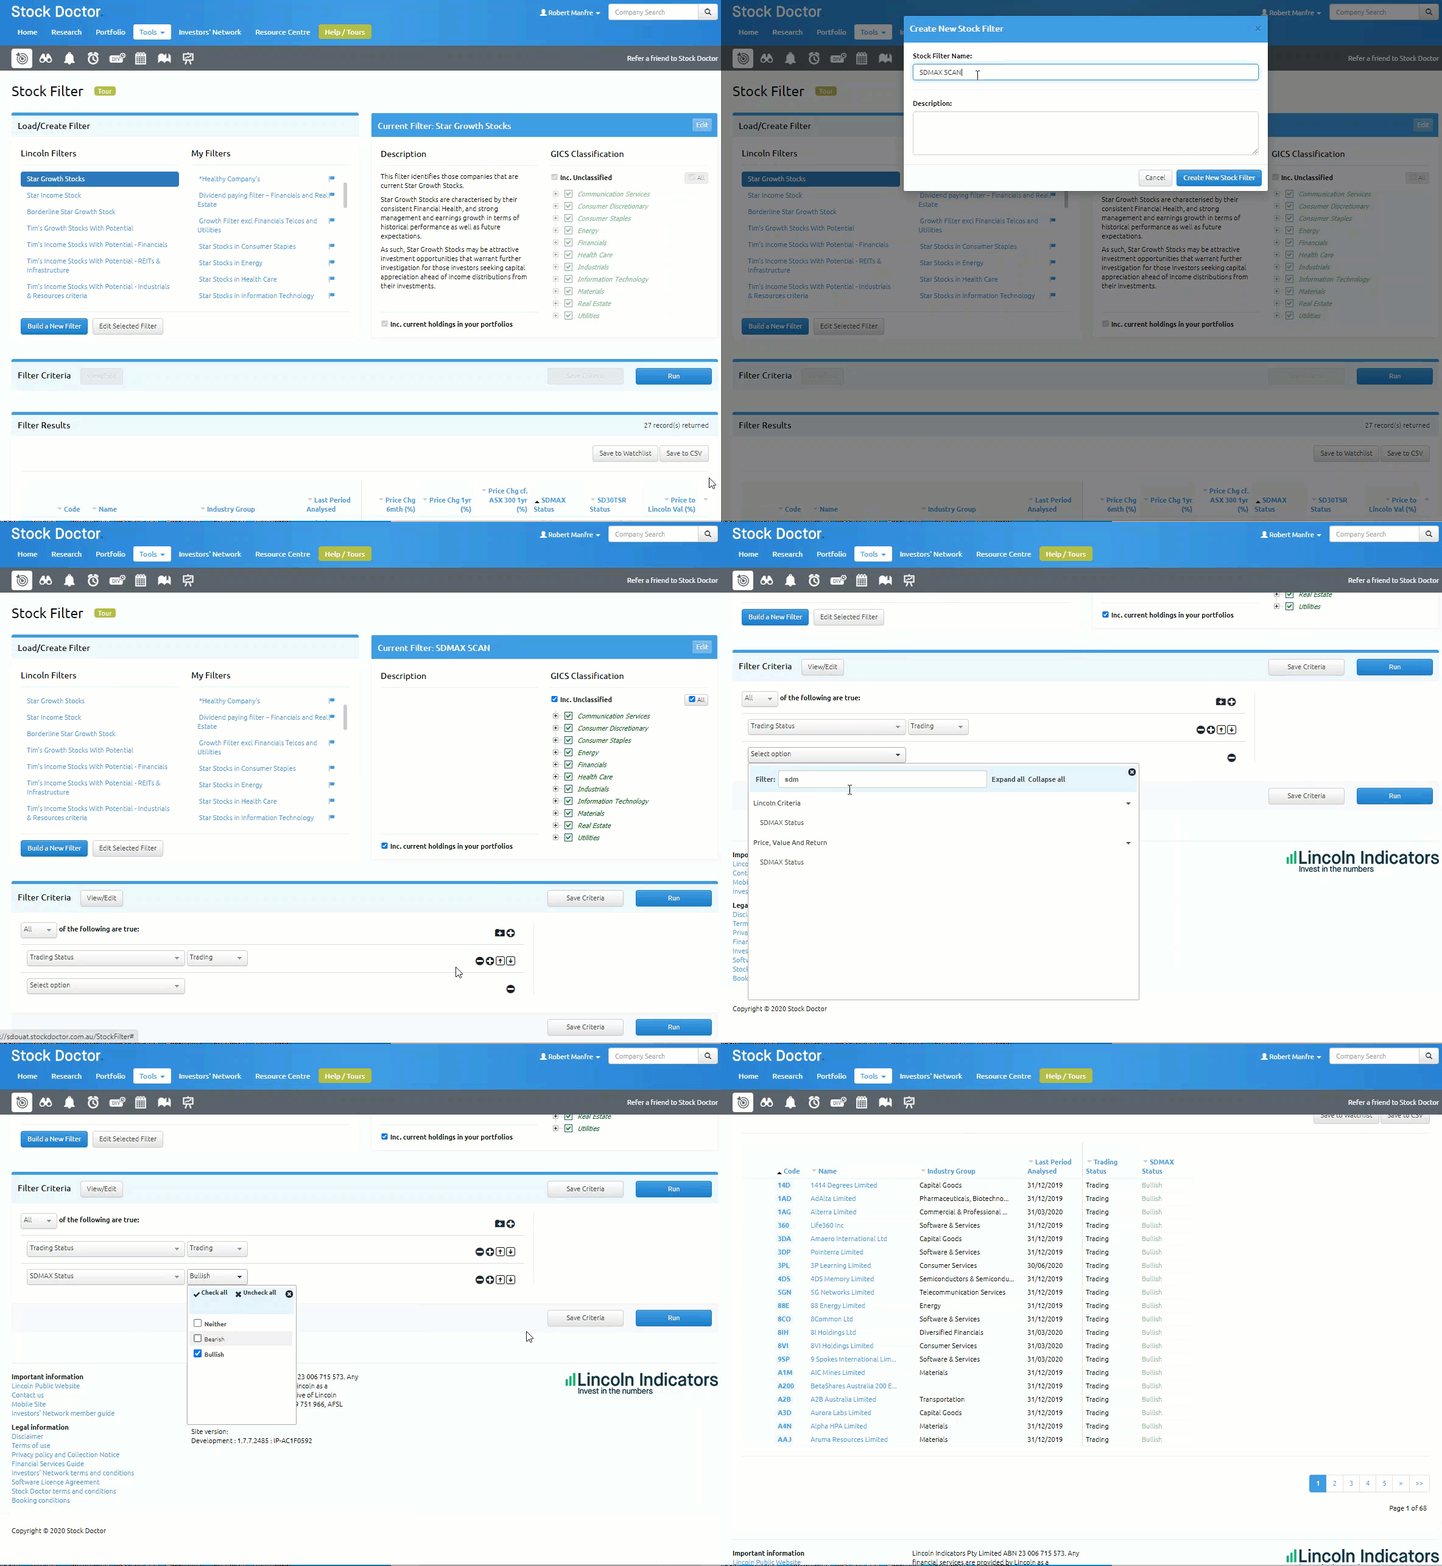
If you are filtering the market for Bullish or Bearish stock prices, you can also build SDMAX into your Custom Filters.
- Select Build a New Filter
- Enter a Filter Name
- Create New Stock Filter
- Click (+) Add Criteria
- Click Select Option
- Select SDMAX Status
- Select Operator: Bullish, Bearish, Neither
- Click Run
Watchlist
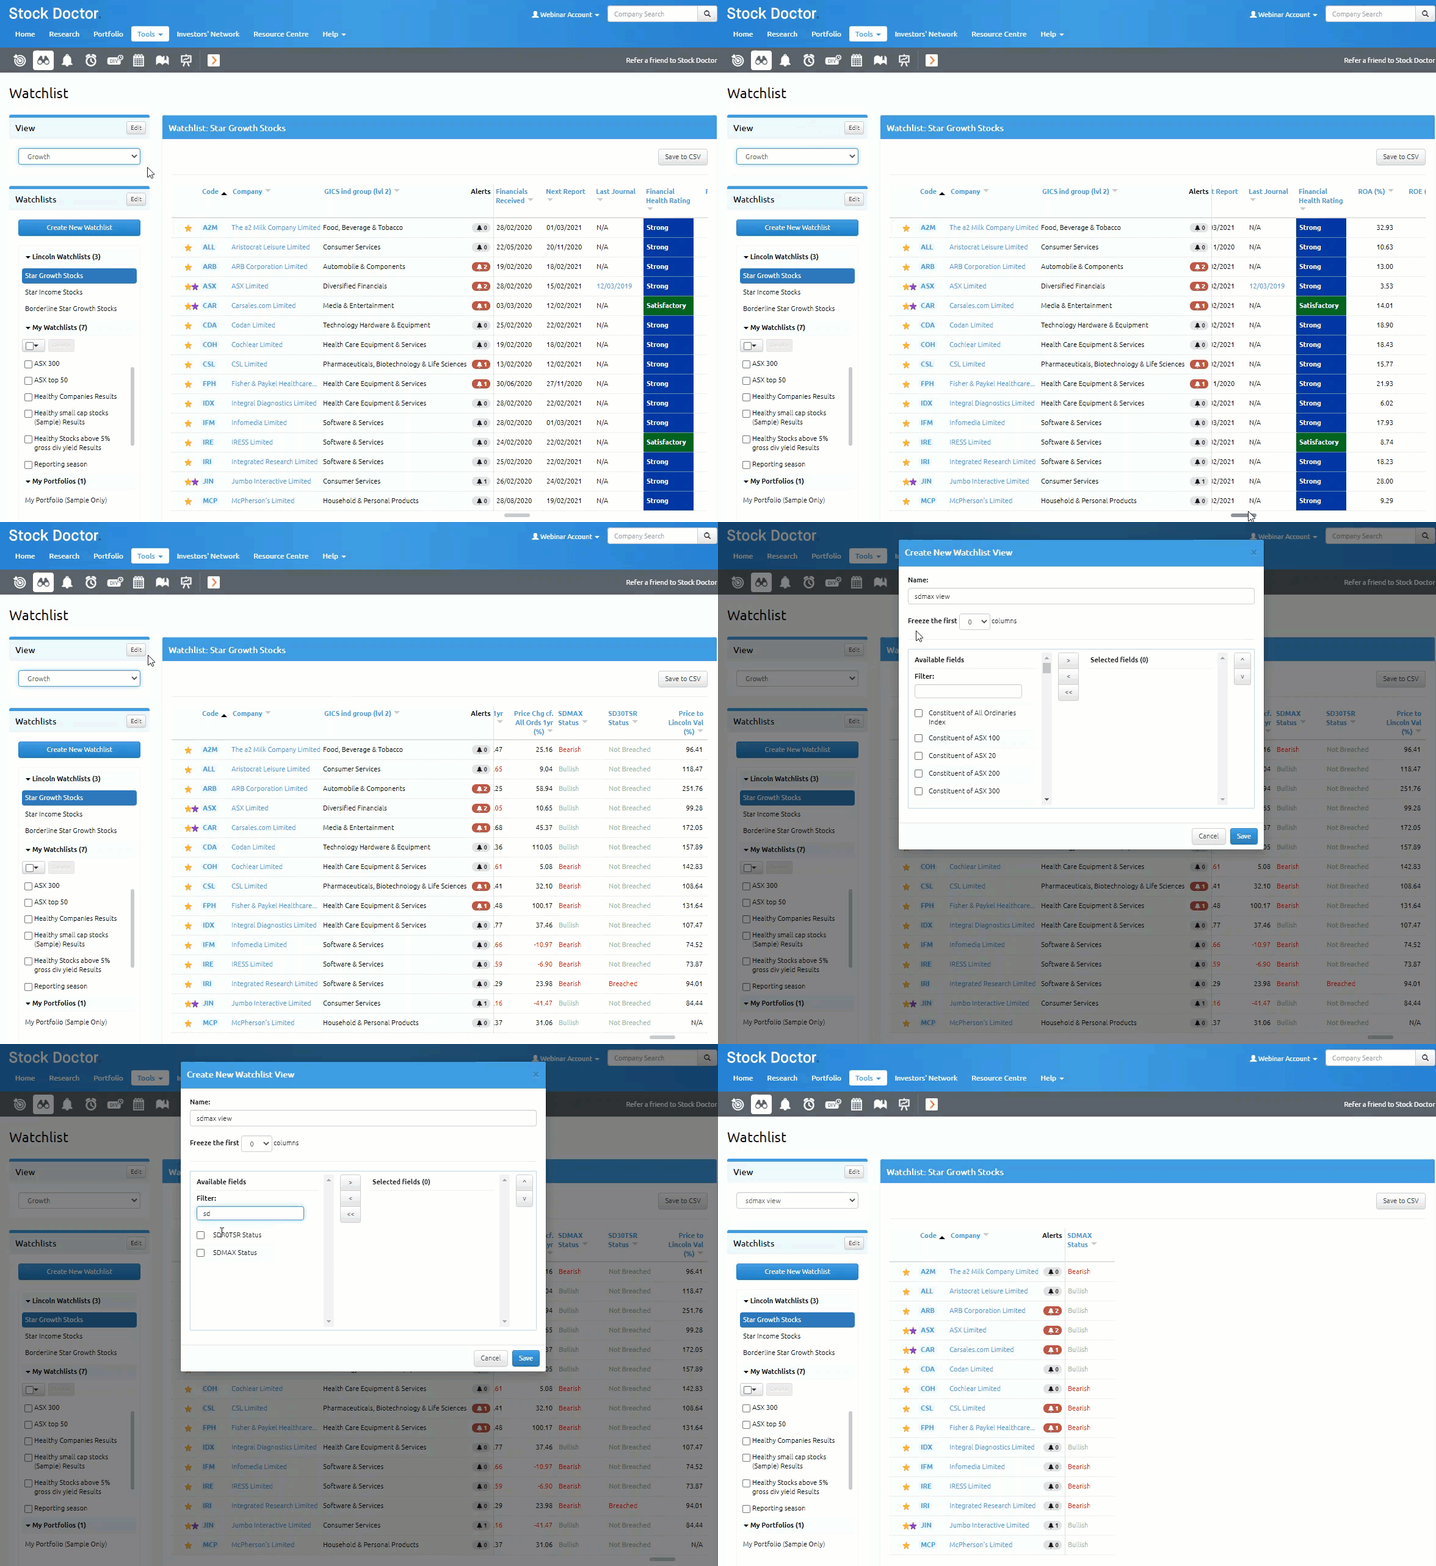
SDMAX is available in Watchlists, within Stock Doctor’s pre-defined Views: Growth, Income and Daily displayed as SDMAX Status and is also a selectable field when building your custom Watchlist view.
- Navigate to Watchlists (Tools > Watchlists)
- Select View drop-down
- Select Growth, Income or Daily
- Scroll to the far right column: SDMAX Status
Add to a custom Watchlist View
- On the right of View
- Click Edit button
- Select Create New Watchlist View
- Enter user-defined view name
- Select SDMAX Status from available fields along with any other fields you would like in your view
- Click on the (>) Button
- Click Save
Important Information: Information presented in this SDMAX Helpfile (Communication) is as 6 October 2020 unless otherwise indicated.
This Communication has been prepared by Lincoln Indicators Pty Limited ABN 23 006 715 573 (Lincoln), as Corporate Authorised Representative of Lincoln Financial Group Pty Ltd ABN 70 609 751 966, AFSL 483167. This Communication t may contain general financial advice. It has been prepared without taking account of your personal circumstances (including your objectives, financial situation or needs) and you should therefore consider its appropriateness in light of your objectives, financial situation and needs, before acting on it. You should read and consider our Financial Services Guide (FSG), which sets out critical information about the services we provide. The FSG is available at www.lincolnindicators.com.au .
The SD30TSR and SDMAX (Indicators) have been identified through a rigorous research process using historical price data against Star Stock selections. Each Indicator has its strengths and weaknesses as outlined in this and the corresponding SD30TSR Communication. The information contained within the Indicators is for general information purposes only. It is not intended as investment advice, or as recommendations to buy, sell or hold a stock and is not to be relied upon as such. Past performance is not an indication of future returns.
Lincoln acts in good faith and has taken the upmost care and precautions to ensure that the Indicators are timely and accurate. However, Lincoln specifically disclaims any liability (whether based in contract, tort, strict liability or otherwise) for any direct, indirect, incidental, consequential, or special damages arising out of or in any way connected with access to, or use of these Indicators including their accuracy, reliability, currency or completeness.
Except as provided by consumer protection law, under no circumstances will Lincoln and its related companies be liable for any loss or damage caused by a client’s use of, access to, or reliance on the Indicators. Contact our office should you required assistance on how to apply these Indicators correctly.
No content in this Communication including illustrations, tables and graphs may be reproduced, adapted, uploaded to a third party, linked to, framed, performed in public, distributed, stored, published, displayed or transmitted in any form by any process without the specific written consent of Lincoln or, in the case of any third- party material, from the owner of the copyright in that material.
Copyright in the Communication is owned or licensed by Lincoln.
Copyright © 2020 Lincoln Indicators Pty Ltd. All rights reserved.