Overview:
Following member feedback, Lincoln Indicators launched its technical indicator, SD30TSR in 2018. When applied to Star Stocks, SD30TSR combines both fundamental and technical analysis to assist in buy/sell decision making. Following further back-testing on Star Stock performance, the indicator was revised in 2020.
Stock Doctor's trailing stop loss 30% exit / 30% re-entry (daily) indicator provides investors with a simple to understand entry and exit signal, to help them manage downside risk to stocks.
This strategy is suitable for investors who are moderately sensitive to price declines, by setting a stop-loss limit at the 30% Trailing Stoploss line from the day a stock is listed. As soon as the price drops below the 30% Trailing Stoploss line, a 30% Trailing Re-entry line is established; which is a guide for the re-entry signal.

How to apply as an exit strategy
The stop loss level is set 30% below the stock price when a stock is listed. As the stock price reaches new closing highs, the 30% stop loss essentially ‘trails’ along ie. moves up to 30% below the closing high. Investors exit once the close price falls below this 30% trailing stop loss level.

How to apply as a re-entry strategy:
Investors re-enter once the stock rebounds 30% above its lowest closing price from when the stop loss was last triggered. As this strategy uses daily prices, investors need to monitor the triggers frequently.

Pro’s
- Allows investors to minimise significant drawdowns (losses) within portfolios
- Having a 30% buffer instead of a smaller percentage stop loss avoids significant churn to your portfolio.
- The daily time frame provides a more active signal. It works well in fast-moving markets.
- Simple to understand and implement.
- Has historically improved portfolio returns during bear markets.
Con’s
- Usually, significant declines in the share price will lead to slippage ie. you will unlikely be able to sell the stock at a price which is exactly 30% below its closing highs.
- The SD30TSR is a fixed percentage change in price and does not take into account the volatility of the underlying stock.
- Following this indicator leads to higher churn and lower win rate than a non-rebalanced portfolio strategy.
- There could be incidences where a stock may fall much more than 30% before the SD30TSR is triggered (i.e. when the stock falls close to 30%, rebounds but then falls again). As such investors need to be cognisant of their position sizing.
Utilising this indicator does not guarantee you will avoid all losses, reduce your losses or achieve improved investment performance. The Indicator is an indication only of stock trends and is not a prediction of future outcomes.
Accessibility
9 Golden Rules Screen
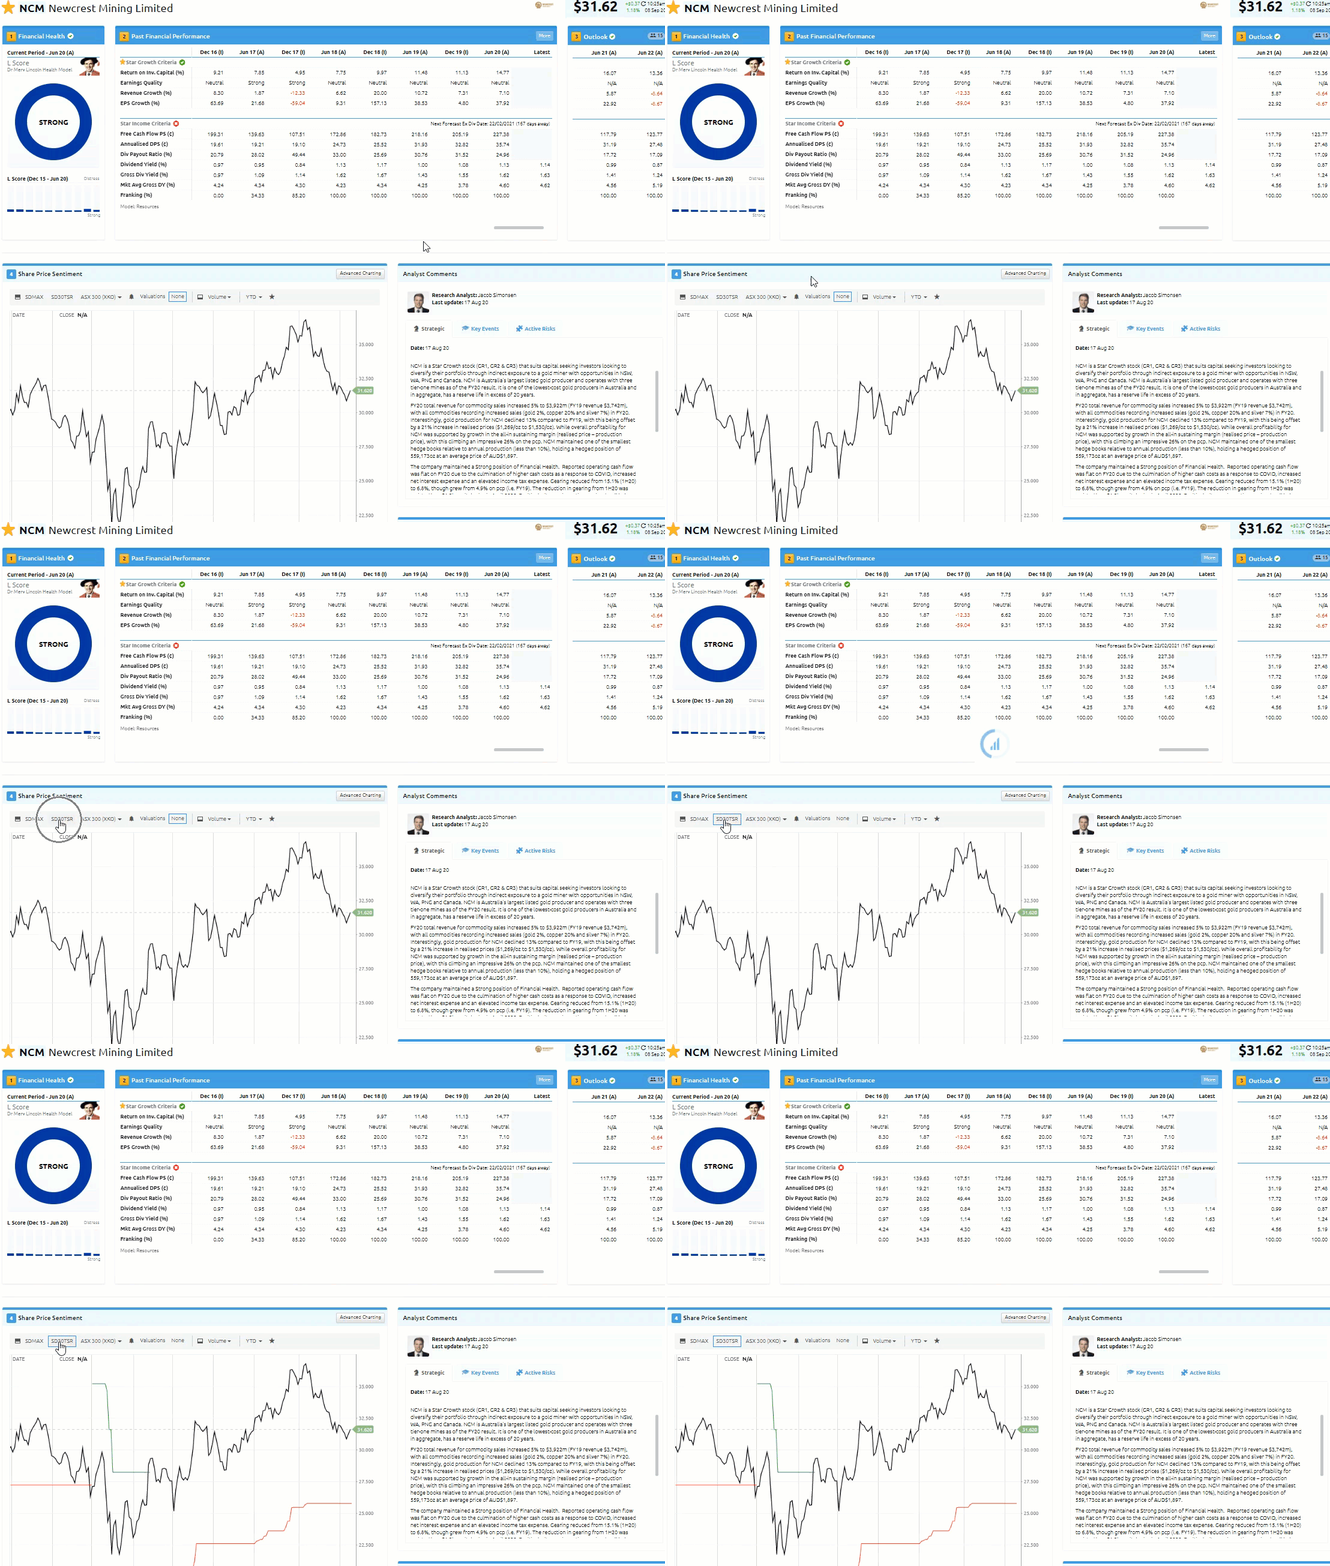
As SD30TSR relates to share price sentiment, it appears under Golden Rule 4.
- Navigate to any company 9 Golden Rule screen
- Under Golden Rule 4
- Click the SD30TSR button
Advanced Charting Tool
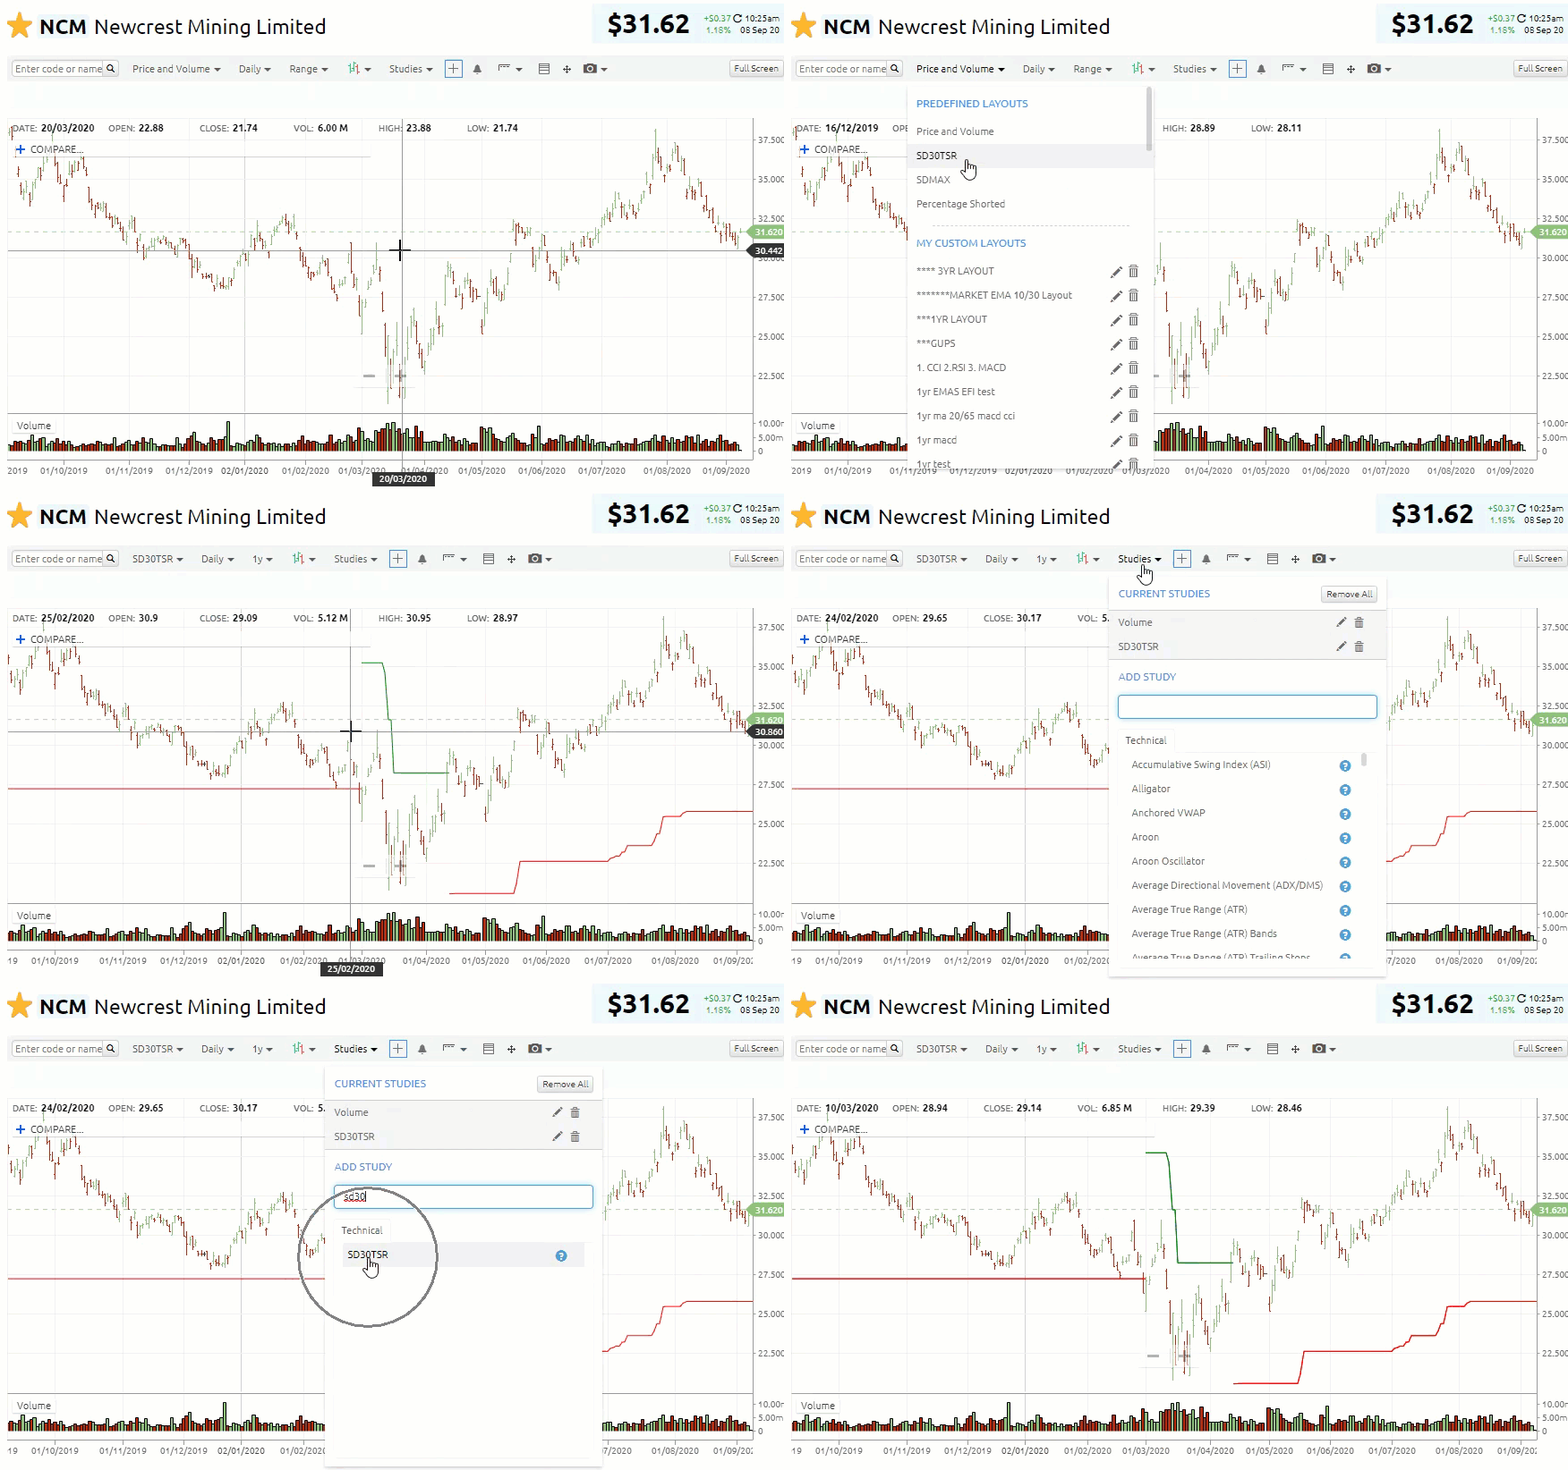
SD30TSR is also accessible when you are in the Charting Tool. Select it from the Layouts Menu or the Studies drop-down menu.
- Navigate to the Advanced charting tool (Tools > Advanced Charting Tool)
- Click on the Layout drop-down menu
- Select SD30TSR
OR - Click Studies
- Select SD30TSR
Stock Filter
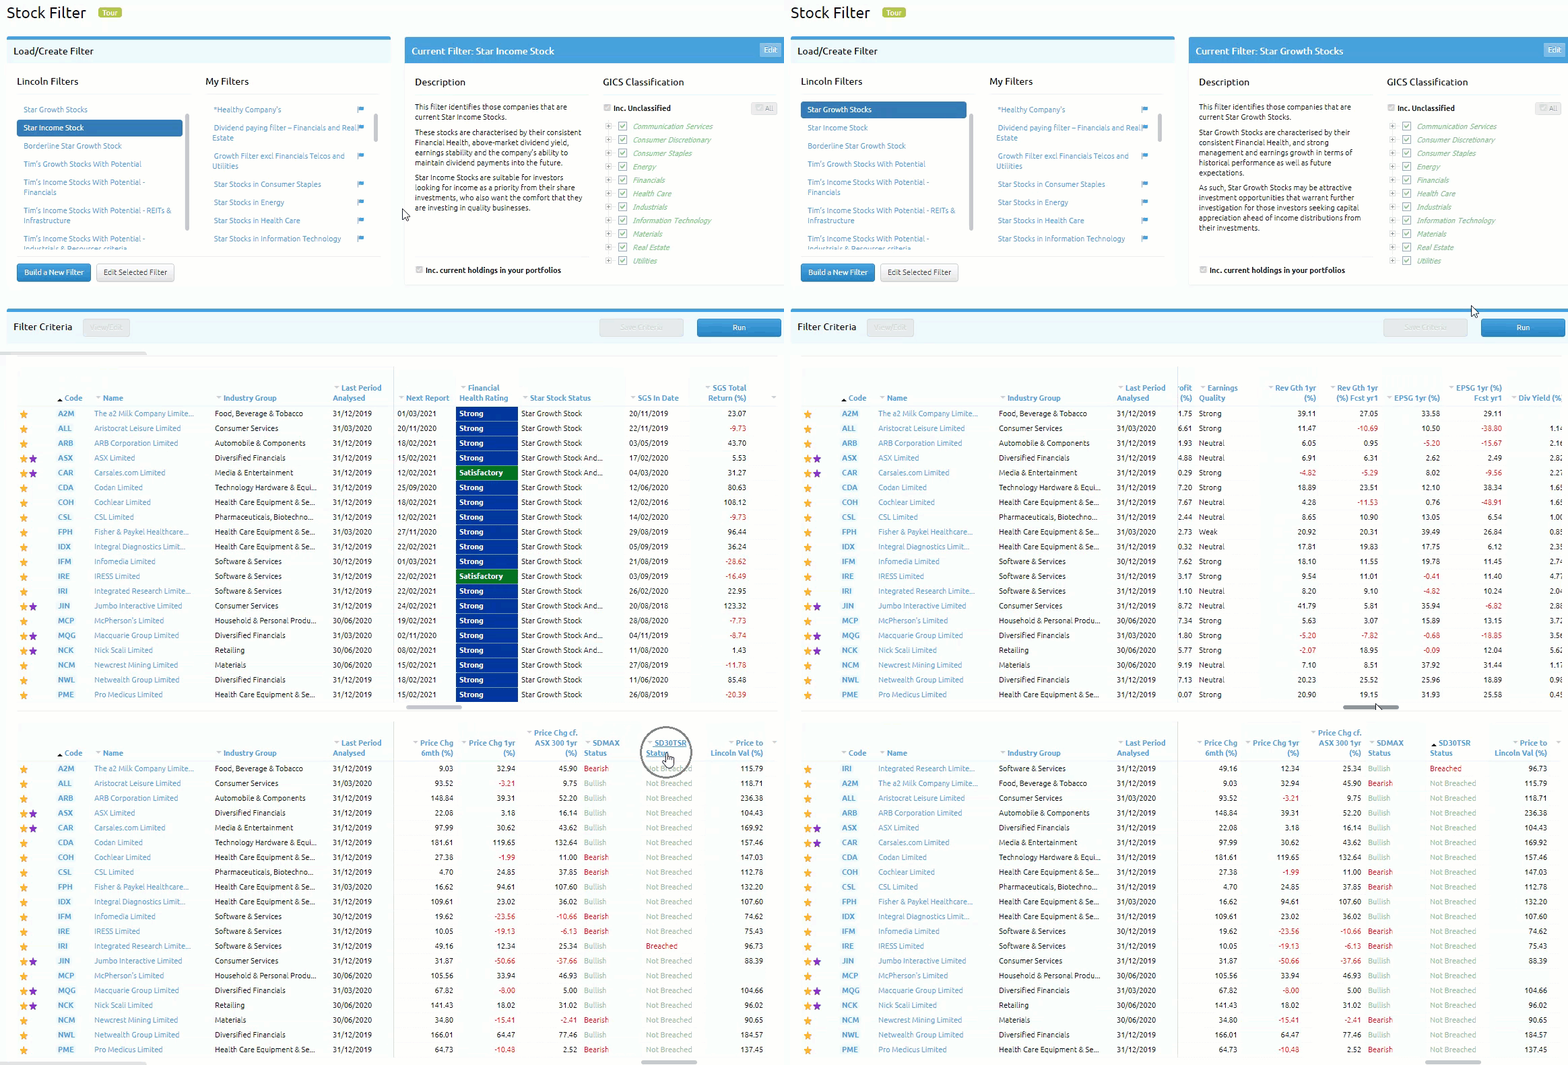
SD30TSR is built into the existing Lincoln Star Stock Filters, for example; Star Growth Stocks. In the far-right column, you will see stocks that have Breached or Not Breached Stock Doctor's 30% stop loss level.
- Navigate to the Stock Filter (Tools > Stock Filter)
- Click on an existing Lincoln Star Stock Filter
- Click Run
- Scroll to the right of results: SD30TSR Status column.
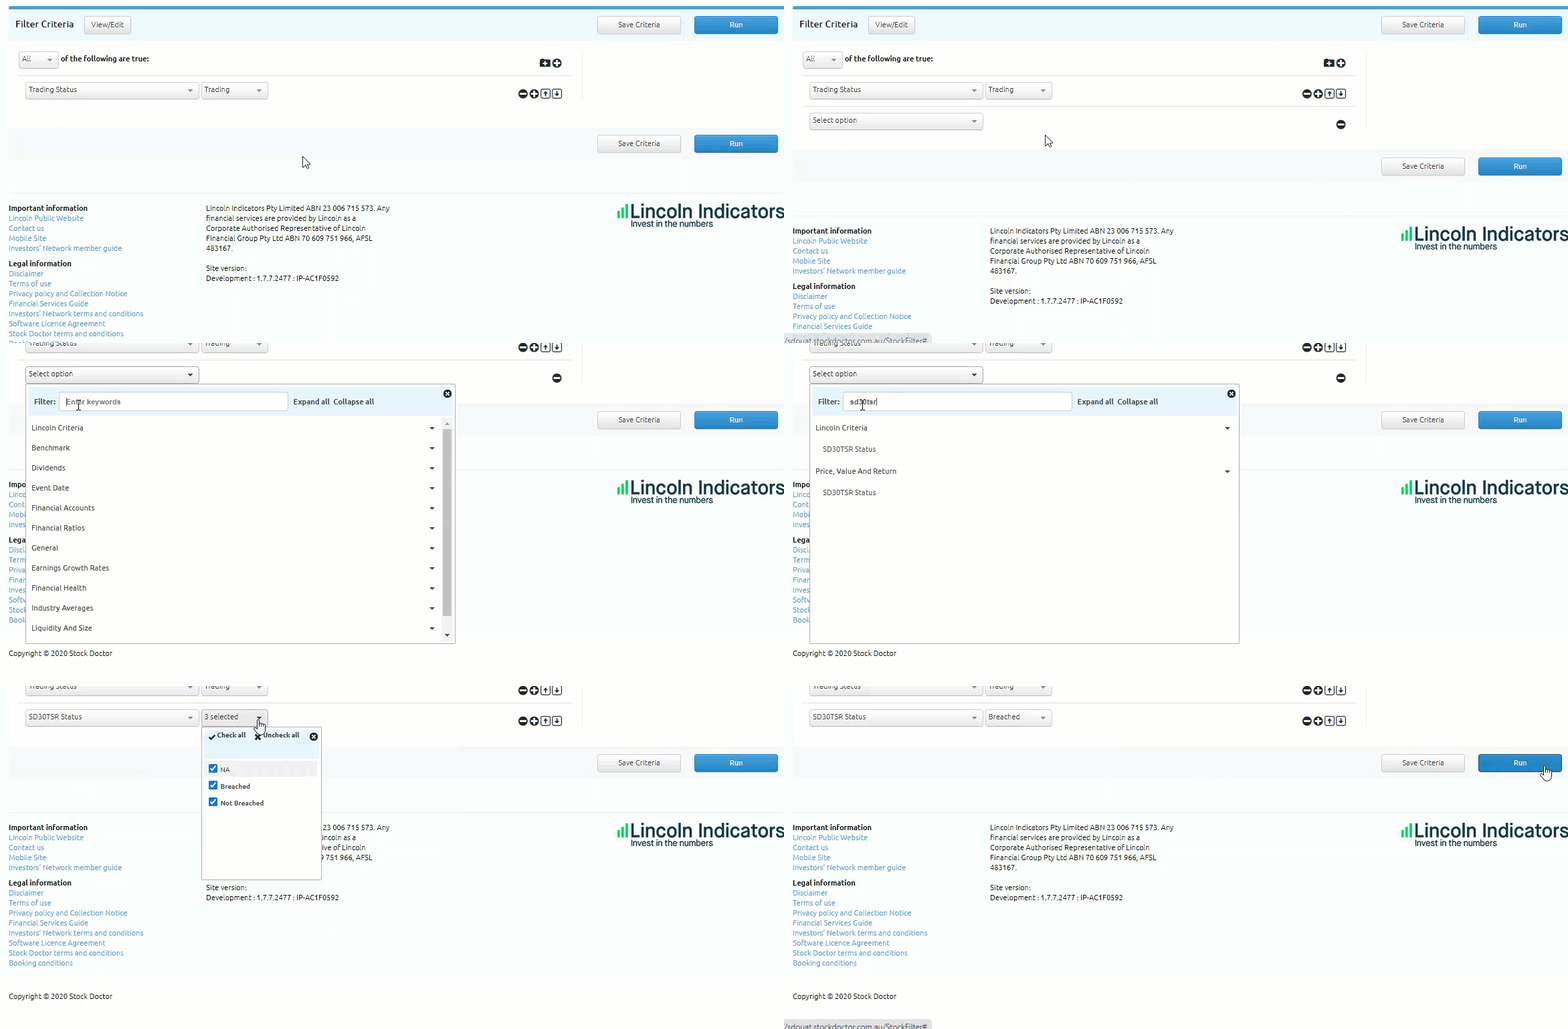
And, if you are creating a custom filter, it is also a selectable criterion.
- Select Build a New Filter
- Enter a Filter Name
- Click Create New Stock Filter
- Click (+) Add Criteria
- Click Select Option
- Select SD30TSR
- Select Operator: Breached, Not Breached, N/A
- Click Run
Watchlist
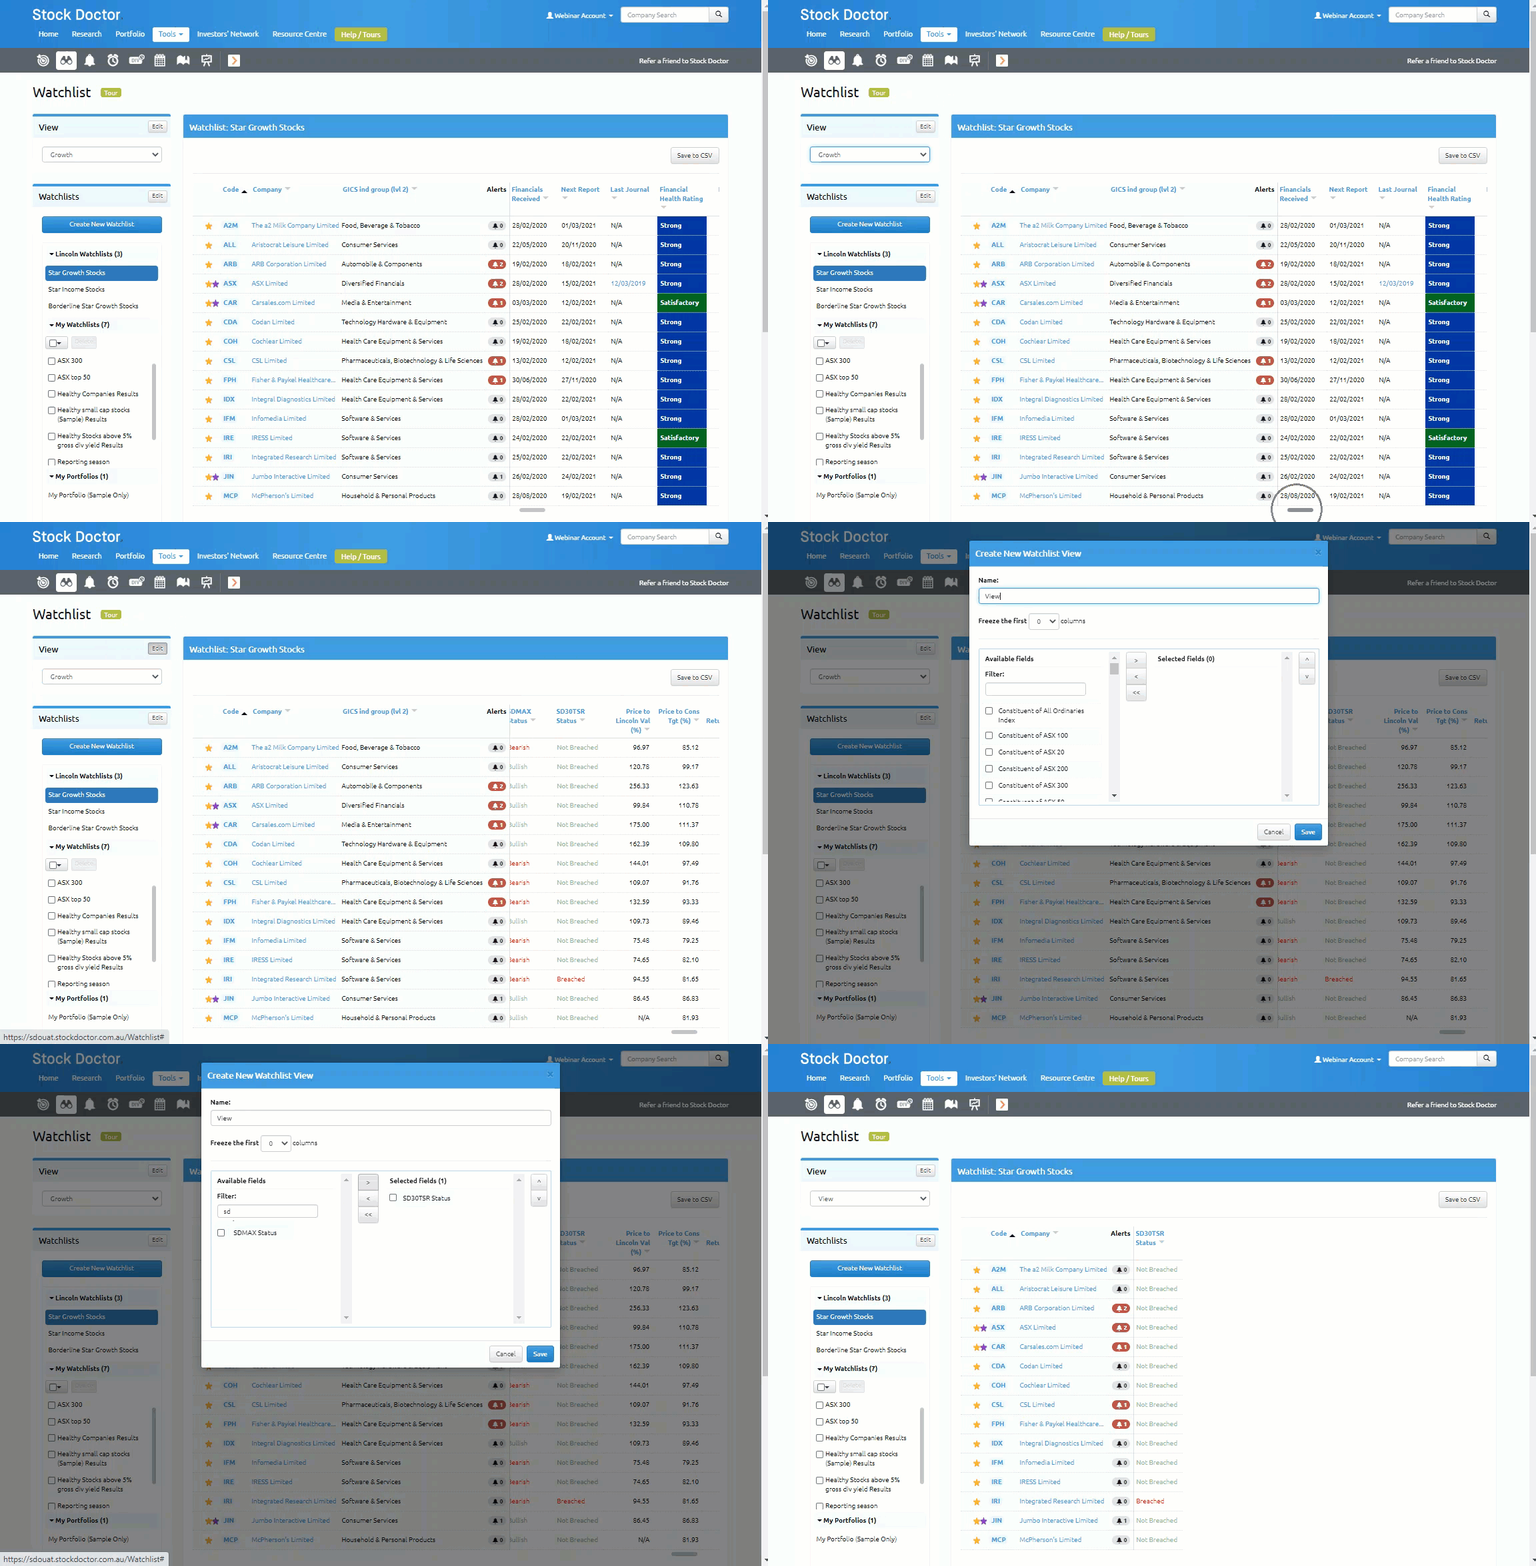
SD30TSR is available in Watchlists within Stock Doctor’s pre-defined Views: Growth and Income, displayed as SD30TSR Status. It can also be added as a field for a custom Watchlist view.
- Navigate to Watchlists (Tools > Watchlists)
- Select View drop-down
- Select Growth, Income and Daily
- Scroll to the far-right column: SD30TSR Status
It can also be added to custom Watchlist View
- On the right of View
- Click Edit button
- Select Create New Watchlist View
- Enter user-defined view name
- Select SD30TSR Status from available fields along with any other fields you would like in your view
- Click on the (>) Button
- Click Save
Important Information: Information presented in this SD30TSR Helpfile (Communication) is as 6 October 2020 unless otherwise indicated.
This Communication has been prepared by Lincoln Indicators Pty Limited ABN 23 006 715 573 (Lincoln), as Corporate Authorised Representative of Lincoln Financial Group Pty Ltd ABN 70 609 751 966, AFSL 483167. This document may contain general financial advice. It has been prepared without taking account of your personal circumstances (including your objectives, financial situation or needs) and you should therefore consider its appropriateness in light of your objectives, financial situation and needs, before acting on it. You should read and consider our Financial Services Guide (FSG), which sets out key information about the services we provide. The FSG is available at www.lincolnindicators.com.au .
The SD30TSR and SDMAX (Indicators) have been identified through a rigorous research process using historical price data against Star Stock selections. Each Indicator has its strengths and weaknesses as outlined in this Communication and corresponding SDMAX Communication. The information contained within the Indicators is for general information purposes only. It is not intended as investment advice, or as recommendations to buy, sell or hold a stock and is not to be relied upon as such. Past performance is not an indication of future returns.
Lincoln acts in good faith and has taken the upmost care and precautions to ensure that the Indicators are timely and accurate. However, Lincoln specifically disclaims any liability (whether based in contract, tort, strict liability or otherwise) for any direct, indirect, incidental, consequential, or special damages arising out of or in any way connected with access to, or use of these Indicators including their accuracy, reliability, currency or completeness.
Except as provided by consumer protection law, under no circumstances will Lincoln and its related companies be liable for any loss or damage caused by a client’s use of, access to, or reliance on the Indicators. Contact our office should you require assistance on how to apply these Indicators correctly.
No content in this Communication including illustrations, tables and graphs may be reproduced, adapted, uploaded to a third party, linked to, framed, performed in public, distributed, stored, published, displayed or transmitted in any form by any process without the specific written consent of Lincoln or, in the case of any third- party material, from the owner of the copyright in that material.
Copyright in the Communication is owned or licensed by Lincoln.
Copyright © 2020 Lincoln Indicators Pty Ltd. All rights reserved.