There are a number of chart settings that you can apply to customise your chart:
Full Screen
Clicking the Full Screen icon in the top right will hide all the Stock Doctor menus and the chart will be resized to fill the full width and height of the browser window. The icon in the top right changes as shown below. Clicking this return the chart to the default display.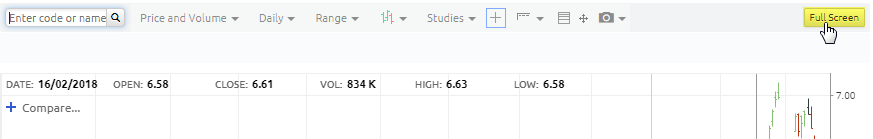
Saving Image
You can save an image of the chart in view including all the customisation by clicking on the Camera icon, then selecting Download PNG Image.
Crosshairs
Enables and disables the Cross Hair pointer on the share price screen, a blue outline will be shown when enabled.
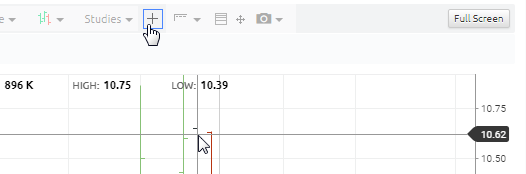
Value Display
Clicking the Value Display button will provide a list of three drop-down options, when selected will provide additional display information. 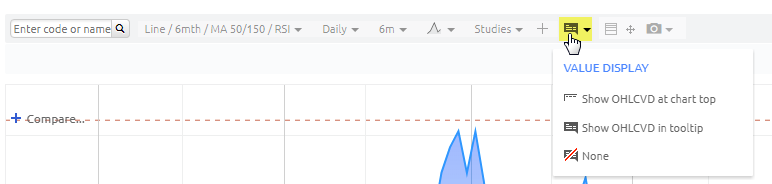
1.  Show OHLCVD at chart top (Open, High, Low Close, Volume, Date)
2a.  Show OHLCVD in tool tip (Open, High, Low Close, Volume, Date)
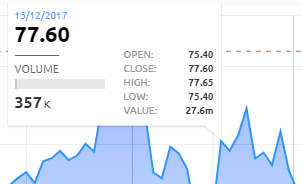
2b.  Enabling this View, with Crosshairs On
  will also provide you Indicator values.
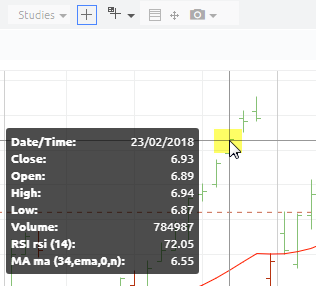
3.  Show no Display Labels
Log Scale
Log scale will toggle the y-axis between log and linear scale.
Rescale Chart
Auto scales Y-axis range of chart.