Within the Action Tabs is where you will find a range of tools required to design charts and draw on them.
Drawing Tools in technical analysis help you analyse price movements in order to identify possible buy or sell opportunities. By either drawing lines on top of share prices or indicators, or by placing markers on charts to mark events or interpret prices, the various options available in the Drawing Tools Tab can be of significant assistance.
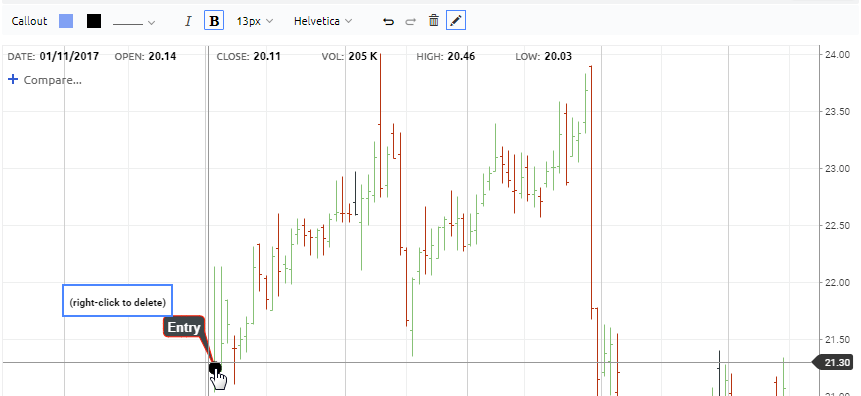
When you click on the Drawing Tool tab, drawing mode will be enabled and a Drawing toolbar will appear at the top of chart allowing you to adjust the properties of the drawing tool prior to being added (See image below).
After you have finished drawing, click on the Pencil Icon  to Turn Off Drawing Mode this will enable your normal cursor to scroll freely again. Note: If you do not switch drawing mode off then you will continue to draw lines every time you click on the chart.
Stock Doctor‘s Charting Tool provides the following list of Drawing Tools:
Annotations
 Text
Text  Callout

To apply Annotations to a Chart:
- Choose an Annotation from the side Drawing Tool menu.
- You have the option of changing the background, font, colour of text in the top Drawing Toolbar.
- Select a point on your chart.
- Type your Note.
- Click Save and you will have your annotation saved to the chart.
Once you have applied your annotation to the chart, you can move the annotation where ever you want by drag and dropping.
* To Delete an annotation, simply Right Click on the text.
Lines
 Segment
 Ray
Ray Infinite
 Continuous
 Vertical
 Horizontal
 Crosshair
 Doodle
 Parallel

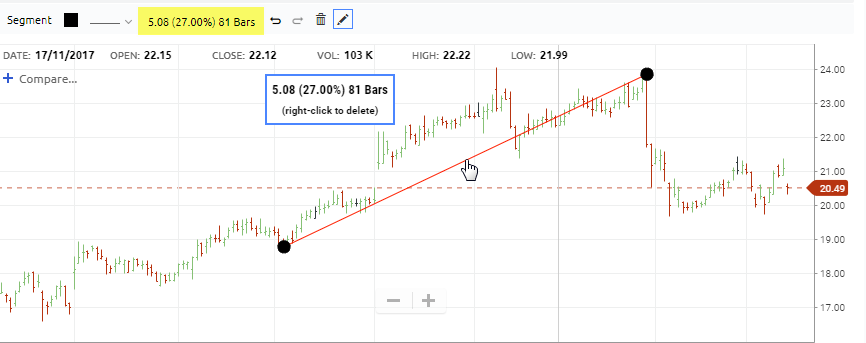
To apply Simple Lines to a chart:
- Click Once at the Start location
- Move your cursor to the End location and Click again.
(This will create 2 pivot points.)
- If you would like to move the line around, you can simply click on the pivot points and relocate the line or you can click on the line itself and move it up, down, left, right.
* To Delete the line, simply Right click on the line.
Cycle Lines
 Equal Cycle Lines
 Fibonacci Time Zone

To apply Cycle Lines to a chart:
Use the same method as drawing a Simple Line.
Fitted Lines
 Average
 Linear Regression

To apply Fitted Lines to a chart:
Use the same method as drawing a Simple Line.
Retracements
 Fibonacci
 Quadrant
 Tirone Levels

To apply Retracement Lines to a chart:
Use the same method as drawing a Simple Line.
Arcs
 Fibonacci Arc
 Speed Resistance Arc

To apply Retracement Lines to a chart:
Use the same method as drawing a Simple Line.
Fans
 Fibonacci Fan
 Gann Fan
 Speed Resistance Line

To apply Fan Lines to a chart:
Use the same method as drawing a Simple Line.
Patterns
 Gartley
 Andrew's Pitchfork

To apply Pattern Lines to a chart:
Use the same method as drawing a Simple Line.
Shapes
 Ellipse
 Rectangle
 Arrow
Arrow Tick
Tick Cross
Cross Focus
Focus Heart
Heart Star
Star

To apply Shapes to a chart:
- Click Once at the location you would like to place your shape.
- Move your mouse up and down to adjust width and height of shape.
- Click mouse again to fix dimensions.
- Move your mouse again to rotate image, then Click a final time to fix location.
- If you would like to move image around, you can simple hover over image and click on height/width icon or rotation icon and relocate the image or hover over image click on the four arrow icon and move it up, down, left, right.
*To Delete the line, simply Right click on the image.