Price Period Frequency
You have the option to customise the graphs in order to display price periods in either a 5 min, 15 min, daily, weekly or monthly time frame via the drop-down shown below.
Note: Price data shown in the Advanced Charting tool is 20 mins delayed. Intraday data can be plot at 5 and 15-minute interval on screen.
Price Range View
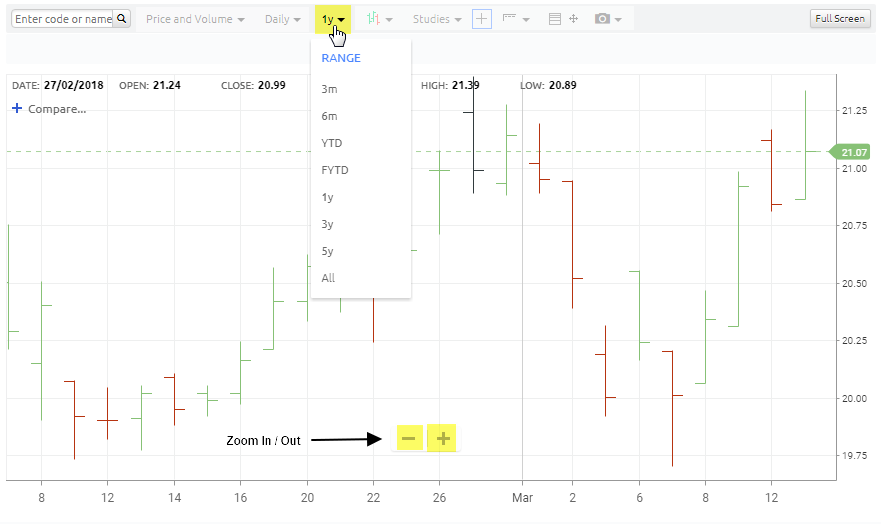
You have the option to adjust the range of data shown on the chart via the drop-down shown below or by clicking on the zoom in / zoom out buttons.

Mouse Shortcuts for scrolling and zooming
Scrolling
- Left click and drag your cursor left or right to move forwards or backwards in time.
- Left click and drag your cursor up or down to move up or down the Y-axis.

Zooming In/Out:
Hover over the date axis, the mouse pointer will change its icon:
- Left click and drag your cursor left to zoom out in time.
- Left click and drag your cursor right to zoom in in time.

Manually Adjust Y-Axis Scale:
Hover over the vertical y-axis, the mouse pointer will change its icon:
- Left click and drag your cursor down to increase the Y-axis and shrink data points on chart.
- Left click and drag your cursor up to decrease the Y-axis and enlarge data points on chart.
