Search Stock/Index
The search box that allows you to search for any ASX listed security using the company name or code, index, ETF or Trust.
The search results will appear in the drop-down list which can be filtered by security type using the tabs "All", "Main Securities", "Derivatives", "Indexes", "Commodities" or "Exchange Rates."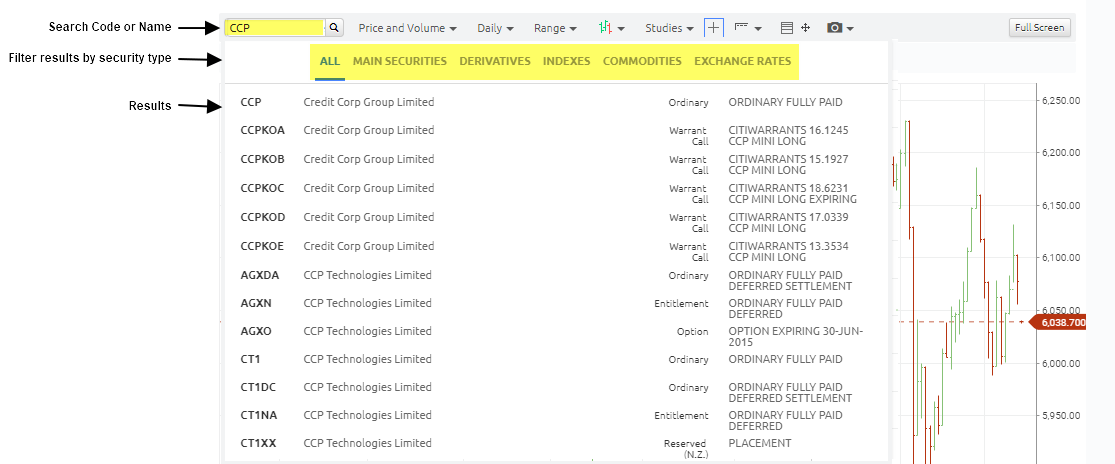
Navigate the list of results using the up and down keys in the drop-down list and press enter on your keyboard or click on any result using your mouse to select. If you know the code you are looking for you can type it in and the press <enter>
Overlay Stock/Index
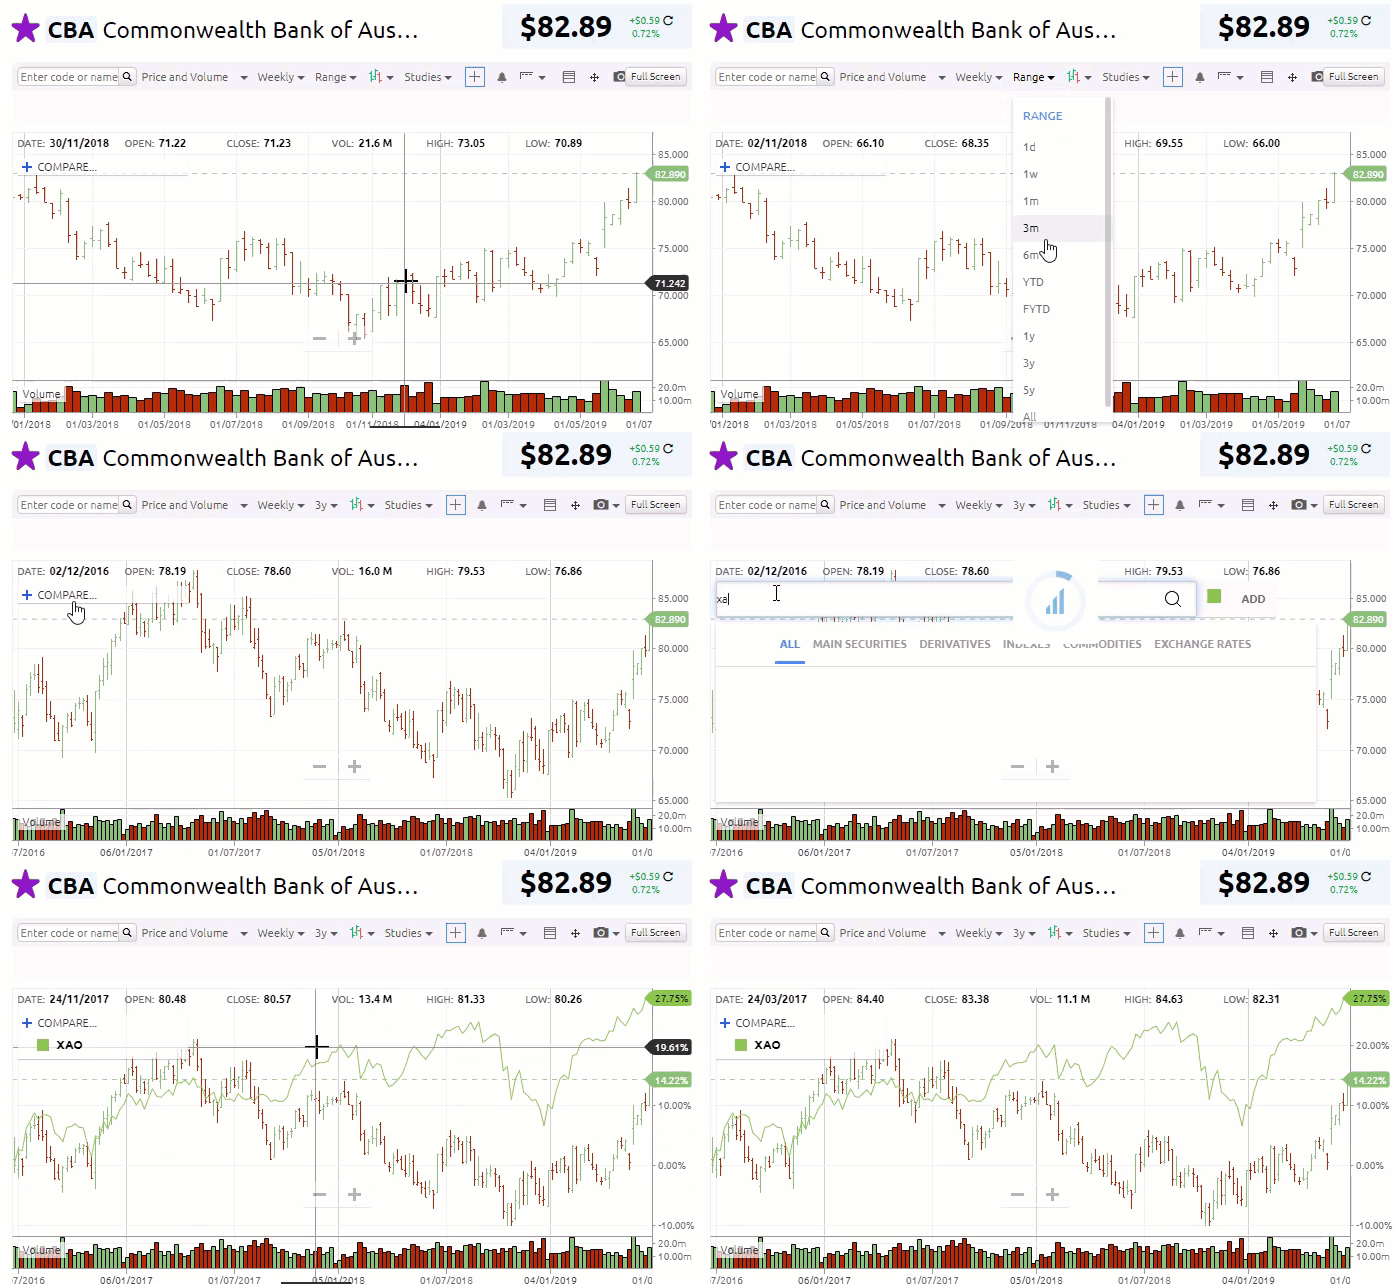
"Compare" allows you to overlay an alternative company stock price or market index on top of the current price chart for comparative purposes.
Clicking the +Compare icon will drop down a search box, allowing you to search for any Code or Index you would like to overlay. This will work in the same way as the chart search described in section above
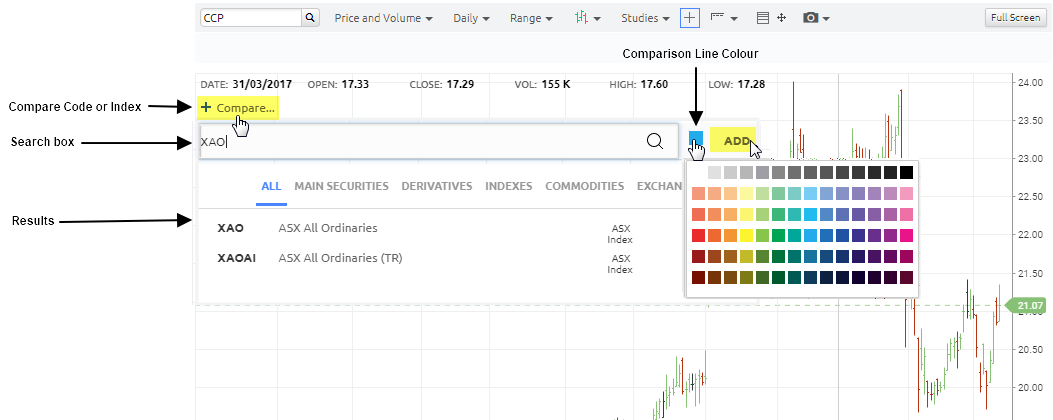
Click on the Coloured square and select the colour of the comparison line.
Then click the Add button with your mouse or press Enter on your keyboard to overlay code.
When a symbol is selected:
- The y-axis is changed to a percentage scale showing the percentage rise in price since the date at the left of the visible part of the chart.
- The selected overlay symbol is overlaid on the main chart pane as a line showing close price (the main chart retains its chart type).
- Both charts will start with their close price at 0% on the y-axis at the left side of the visible portion of the chart. When the chart is scrolled, the overlaid chart is moved up or down so it’s close at the left edge coincides with that of the main chart.
- A legend for the overlay showing the line colour, overlay code and closing value for the last period is display below the + Compare (top left of main chart).
Comparing two items together on one chart using the overlay feature allows the user to see how two stocks or currencies track together over time. It is easy to spot when the move together and when they move apart and determine if they are positively, or negatively correlated. If positively correlated, when they diverge it could be a trading opportunity. Conversely, if they are typically negatively correlated then when they track together there also could be an opportunity – or a warning!
Using the compare feature sets one or more items to start at 0% and we can then see how they move apart and together over time. This is great for comparing many sectors of the stock market together.
To Delete an Overlay
There are 2 methods you can use to delete an overlay from a chart:
1. Right click on the overlayed line.
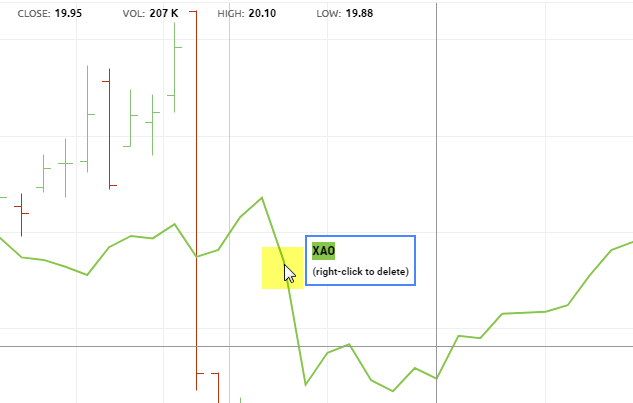
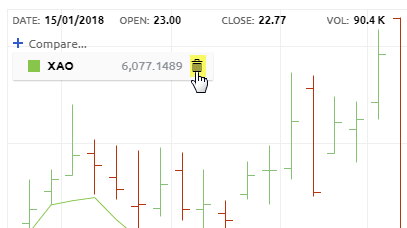
2. Click on the Trash can on the right of the overlayed code under +Compare icon.
