Analyze the relationship between two instruments
Indicator Type
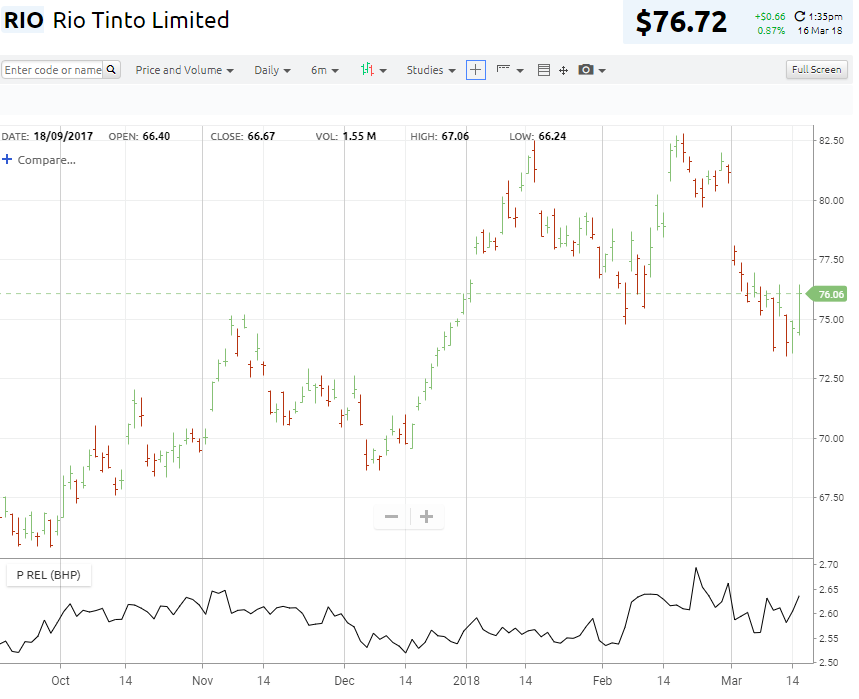
Relative performance Indicator
Works Best
All market types and time frames.
Formula

A simple ratio of A / B.
Select the item to be used as “B.”
Select the “Result” box to bring up a color pallet.
Theory
Price relative, also known as relative strength or just ratio, can show when the relationship between the items has changed. It can also be used to display one instrument in an alternate form. By plotting the ratio of unlike items gold and euros, one could see the price of gold denominated in another currency.
Interpretation
Price relative charts help the trader exploit the relationship between two instruments without regard to overall market direction. For example, they can help determine if an industry group such as autos is leading or lagging the market. Trendlines applied to the chart can tell us when that relationship is changing and therefore creating a trading opportunity. This also allows for performance analysis – hence the name relative strength – between two stocks or indices or even asset classes without regard to absolute market direction.
The old saw says to buy the strongest stocks in the strongest groups, Price relative allows for quick analysis in this area.
The chart type used is usually a line chart. Trend lines, moving averages and other technical tools can then be applied to analyze the plot like any single instrument. The most important aspects of the analysis are trends and trend breaks.