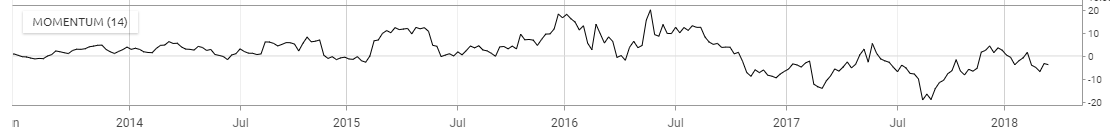
The momentum indicator is used to identify overbought/oversold conditions.
Indicator Type
Momentum indicator
Works Best
All markets and time frames
Formula
( (Current Price – Price n-periods ago) / Price n-periods ago) * 100
Parameters
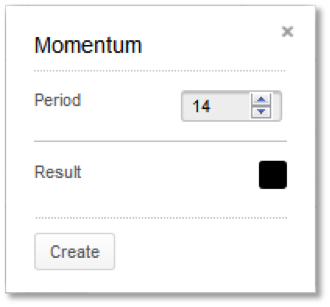
Commonly used parameters are 10 and 21 days and 52 weeks. Choose the period value to coincide with market cycles.
Defaults to 14 periods.
You can also select colours for the momentum chart by selecting the result box to bring up a color palette.
Theory
If we could determine that the speed of rising or falling prices is declining, we would then be forewarned that a market top or bottom may be near. A market will tend to continue in the same direction in which it is moving until it meets support or resistance. If a market is moving with falling momentum, it will continue to move in the direction of the trend, but at slower and slower speeds until it just stops, similar to a tired long distance runner.
Interpretation
There are four basic events to follow on a momentum chart. The first is a crossing of the zero line. If momentum is negative and crosses the zero line to positive territory, it could be a buy signal. Note that this is only a valid signal when the line is crossed in the direction of the prevailing trend.
The second event is a divergence with price action. If prices make lower lows but momentum makes higher lows, down side market momentum is declining.
The third event is a very high or very low level of momentum, which may indicate an overbought or oversold condition. Since momentum is not indexed (constrained to move between 0 and 100) we must make a comparison to historical levels in that specific market to determine if it is overbought or oversold.
Trend line analysis can also be used on momentum (event number four). Trend breaks in indicators often precede trend changes in price.