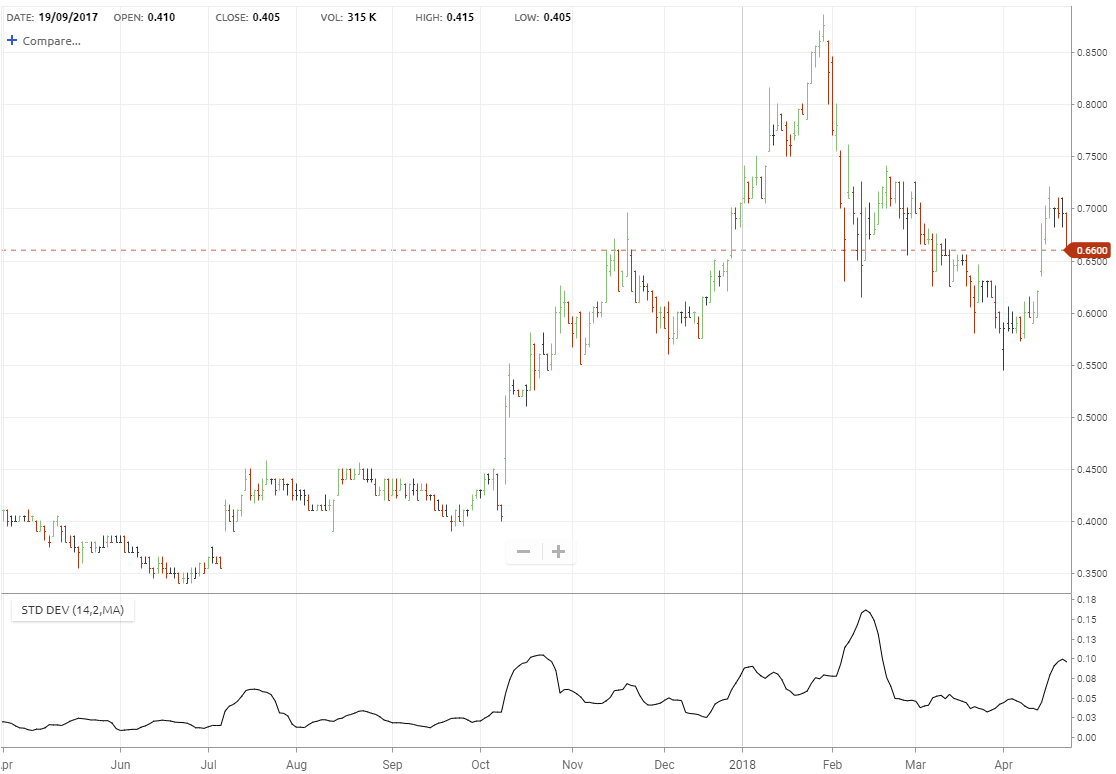
Standard deviation of the closing price is a statistical measurement of volatility. It is derived by calculating an N-time period simple average, summing the squares of the difference between the data item and its moving average over each of the preceding N-time periods, dividing the sum by N and then calculating the square root of this result.
Although usually used in conjunction with another indicator, it can be useful when used in isolation, particularly when helping to identify peaks and troughs. Because a high Standard Deviation value signifies high volatility, and often this occurs near major tops, then it may be an identifier for a potential change. Similarly, low Standard Deviation values signify low volatility and given that major bottoms are accompanied.