Used to identify trend direction and possible turning points. In flat markets, they can identify overbought and oversold.
Indicator Type
Moving average envelope
Works Best
All market types and time frames.
Formula
The upper and lower lines form an envelope drawn a number of Average True Ranges(ATRs) above and below a moving average.
Parameters
20-period exponential moving averages and 2 ATRs are the commonly used parameters.
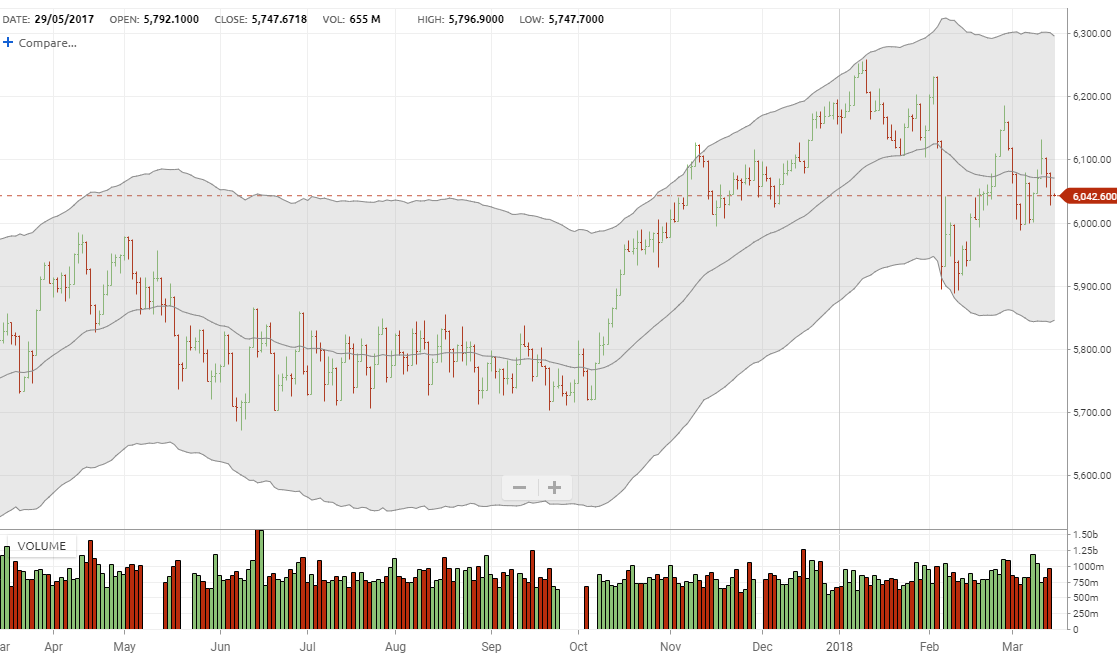
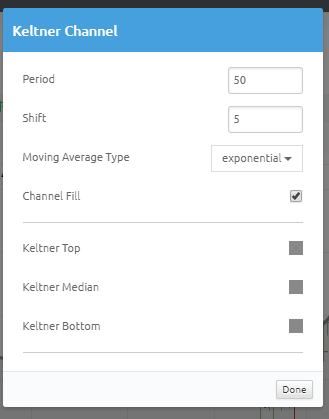
defaults to a 50-period exponential moving average of the close with the bands drawn at 5 ATRs (the shift) above and below the average. This is a much less sensitive calculation that will only react to major market changes.
You can change all parameters, including moving average type, by selecting the proper box.
You can select to fill in the bands to highlight them against the background of the chart or leave them hollow for a cleaner look.
You can also select colors for the top, median and bottom lines by selecting the appropriate box to bring up a color palette. The color for the median line determines the color for filled bands.
Theory
The theory behind channel is that its width should be determined by the data-series itself rather than by the assumptions of the speculator, as done with percent envelopes. In this way, the envelope’s distance from the mean is a function of the market’s actual intra- and inter-period price movements.
Keltner Channels are very similar to Bollinger Bands but determine width based on Average True Range instead of standard deviation. This presents a smoother channel because the latter is more volatile. Many consider this a positive because it creates a more constant width. The standard formula for Keltner uses an exponential average, which is faster than a simple average, although both indicators are able to substitute any average type.
Interpretation
Channels and bands are designed to contain most trading. Therefore, moves above or below the channel lines suggest a change is happening. In flat markets, touches of the bands can indicate overbought and oversold condition. If prices move above the upper band it may be a breakout signal. In rising market, it is not uncommon to see prices spend time above the bands but in this case it is a sign of strength. Conversely, in a down market, speaking time below the bands is a sign of weakness.