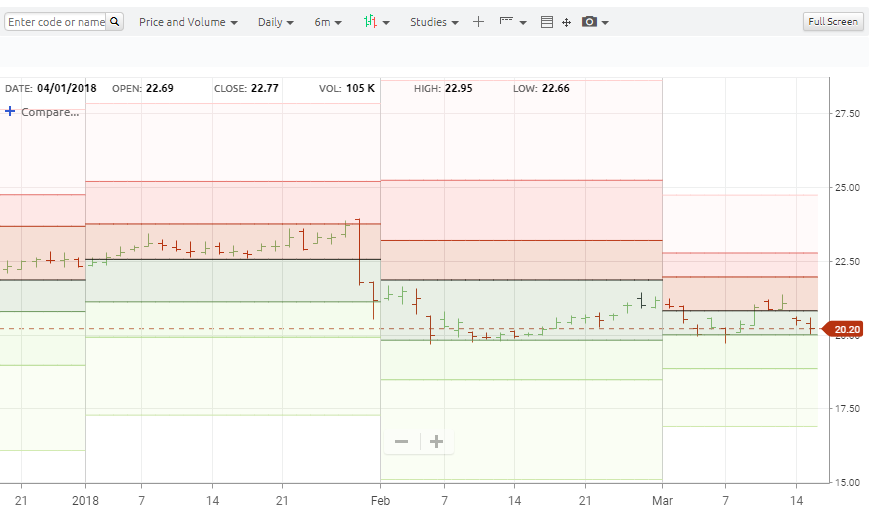
Pivots points are used to identify intraday support, resistance and targets.
Indicator Type
Support/Resistance
Works Best
Short-term trading of active markets
Formula
The pivot point and its support and resistance pairs are defined as follows:
- Pivot point (P) = (H + L + C) / 3
- Third resistance level (R3) = P + 2*(H – L)
- Second resistance level (R2) = P + (H – L)
- First resistance level (R1) = (2 * P) – L
- First support level (S1) = (2 * P) – H
- Second support level (S2) = P – (H – L)
- Third support level (S3) = P – 2*(H-L)
where H, L, C are the previous period’s high, low and close
Parameters
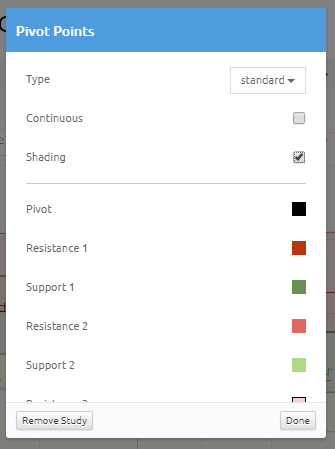
There are no parameters to set but you can select color for each pivot level by selecting the boxes next to each to bring up a color palette.
With the shading box, you can select to fill in the zones between pivot levels to highlight them against the background.
Theory
The pivot point itself is simply the average of the high, low and closing prices from the previous trading period. On the subsequent period, trading above the pivot point is thought to indicate ongoing bullish sentiment, while trading below the pivot point indicates bearish sentiment.
For any market, there is an equilibrium point around which trading activity occurs. In the absence of large numbers of new buyers or sellers, this point serves as the pivot or focal point for floor traders (locals) and market makers as they adjust their bids and offers. When prices move away from the pivot, there are zones of support and resistance that can be derived from the established value area in the market. Penetration of these zones leads to perceived changes in valuation and the entry of new players into the market.
The valuation parameters used by floor traders can be calculated with the simple formulas above. Knowledge of the levels at which different types of traders enter the market can help in determining when a shift in valuation by the locals has occurred. This is especially useful when there is little outside influence on the market and trading is dominated by the locals.
Interpretation
Pivots are based on the volatility of the prior period. Trading for the current period will usually remain between the first support and resistance levels as floor traders make their markets. If either of these first levels penetrated, off-floor traders are attracted into the market. These breakout levels then usually reverse their function and serve as test points, i.e., previous resistance becomes support or previous support becomes resistance. The range of trading has expanded and if a second support or resistance level is breached then longer-term traders will be attracted.
Floor traders regularly take the market up and down within their value range so orders placed within it are likely to be executed. This can cause a problem as whipsaws can occur. However, by placing stop orders outside this range it is more likely that a trend emerging from the local “noise” of the market can be captured.