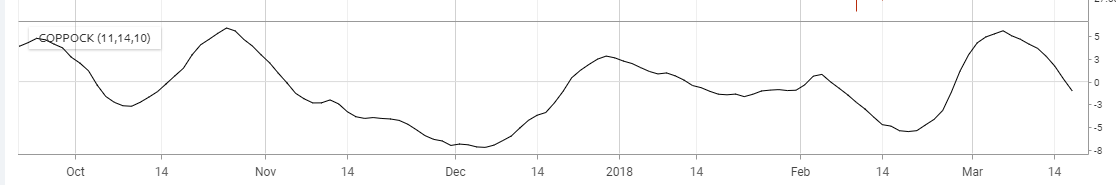
Created by Edwin Coppock. Designed to signal when stock market "mourning" would be over following a crash in it's price. This period was thought to be between 11 and 14 months as this is how long church leaders advised Coppock that it took for a person to get over the death of a loved one.
Attempts to identify entry signals in a market by looking at market activity on a monthly time range.
It adds the rates of change for a short and a long period of months and then smooths by another period's weighted moving average. Possible buy signal occurs when the indicator is below 0 and then rises above it.
With default parameters this indicator is intended for a monthly chart. To adapt to a daily chart change parameters to 231 and 294 for ROC periods and 210 for the WMA periods.