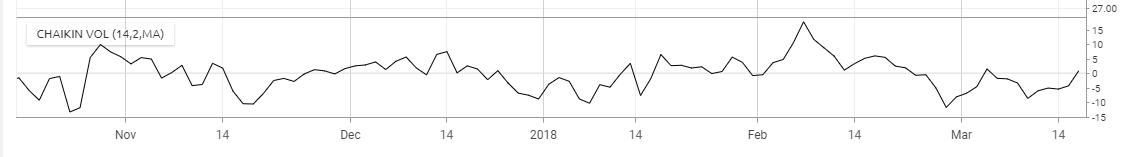
Chaikin's Volatility indicator (CVOL) compares the gap between a share's high and low prices. Volatility is measured as a widening of the range between the high and the low price.
The CVOL can be interpreted as a means of identifying the end of a trend. It is said that market tops are generally accompanied by increased volatility (as investors get nervous and indecisive) and that in the latter stages of a market bottom, the lower volatility is present (as investors get bored). 
Another way to interpret the CVOL is to assume that the increased volatility over a relatively short time period may indicate that a bottom is near. A decrease in volatility over a longer time period indicates a possible approaching top.