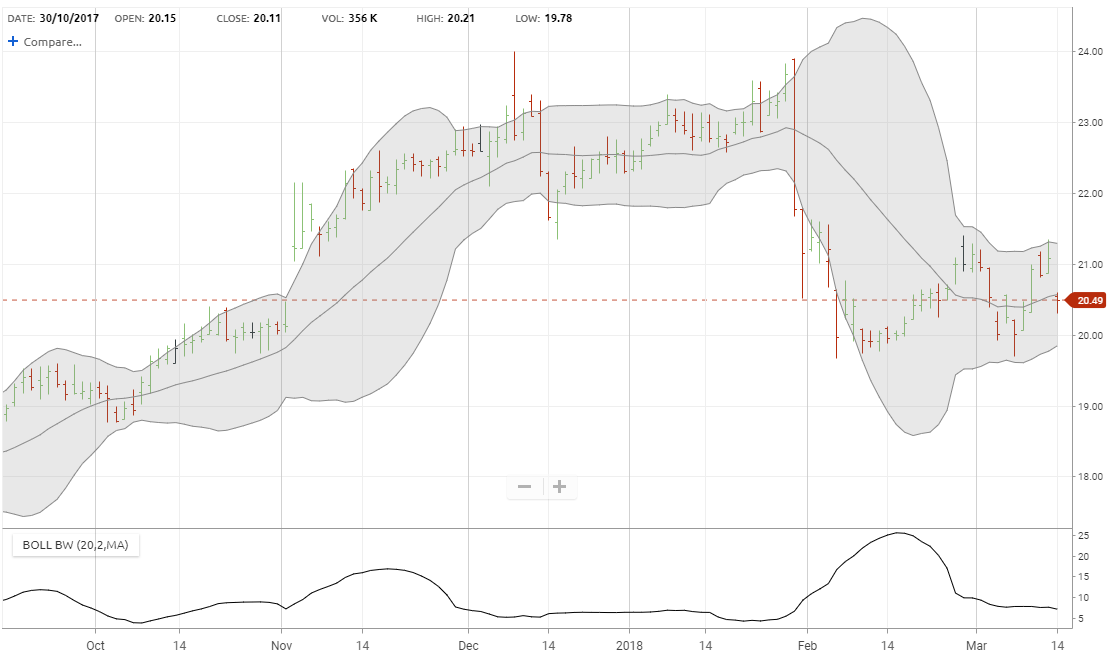
The bandwidth indicator is used to identify situations where an instrument in a trading range or consolidation pattern is about to begin a directional move.
Indicator Type
Volatility Oscillator
Works Best
All market types and time frames although daily is the most popular.
Formula
Bollinger Bands form an envelope drawn a number of standard deviations above and below a moving average. Bandwidth measures the percentage difference between the upper and lower bands and therefore the volatility level.
Parameters
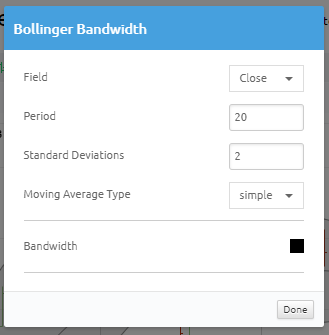
20-period simple moving average and 2 standard deviations are the recommended parameters. However, different intervals may require different average and deviation calculations. Typically, bandwidth parameters will match the user’s preferred Bollinger Band parameters.
Defaults to the recommended 20-period simple moving average of the close with the bands drawn at 2 standard deviations above and below the average.
You can also change color for the plot by selecting the box to bring up a color palette.
Theory
The theory behind the bands is that the width of an envelope should be determined by the data-series itself rather than by the assumptions of the speculator, as done with percent envelopes. In this way, the envelope’s distance from the mean is a function of the market’s volatility. The bandwidth indicator allows for quick and objective visualization of expanding and contracting volatility periods over time. It also allows for comparisons across time for an instrument with a large change in price as well as to other instruments since the result is normalized for price level.
Interpretation
See the Bollinger Bands document in the resource center for more on the bands.
The first step is to determine what constitutes narrow and wide bands for a particular instrument. Bandwidth must be judged in comparison to recent history as well as in context to a longer period of time. Therefore, there is not one level of bandwidth that is considered to be narrow or wide for all instruments and all times. This is similar to determining what it overbought or oversold with non-indexed momentum indicators such as MACD.
John Bollinger postulated that volatility cycles from high to low and therefore Bollinger Bands also tend to expand and contract. Often times, traders can get advance warning to a breakout from a flat period of trading when the bands start to expand. However, the direction of the breakout is not determined by band expansion alone. For that, traders must wait for prices to move above or below the bands to indicate the breakout in that direction.