ATR stands for Average True Range and incorporates the change from the previous close into calculating the periods range (volatility).
Indicator Type
Volatility measure
Works Best
All market types in daily and weekly time frames, although it can be used intraday, as well.
Formula
The True Range is the largest of (high – previous close), (previous close – low) or (high – low).
Parameters
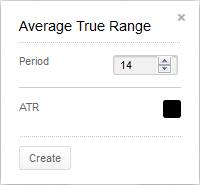
Select the number of periods for the simple moving average of the True Range. Defaults to a 14-period average of the True Range.
You can also select the color for Average True Range line by selecting the box to bring up a color palette.
Creator Welles Wilder used a 10-day parameter.
Theory
Although it can be used alone to help determine a market’s volatility, ATR is usually used as a qualifier in other indicators by, for example, adapting their parameters to a stock’s volatility. A stock experiencing a high level of volatility will have a higher ATR, and a low volatility stock will have a lower ATR.
In any time period, the range is often used as a measure of volatility. However, if the range occurred at a significantly different level than the prior range the jump up or down would not be factored in using simple range formulas. Intraday time frames do not see the jumping or gapping action as daily or weekly time frames so ATR would be less important there.
Interpretation
The Average True Range can be interpreted using the same techniques that are used with the other volatility indicators.
Volatility often moves from periods of high levels to periods of low levels, and back. We can find low volatility by comparing the daily range to a moving average of the range.
When the stock or commodity breaks out of a range, it is likely to continue moving for some time in the direction of the breakout. However, an opening gap would hide volatility when looking at the daily range. If a market jumps greatly at the open, the ensuing range may be very small even though volatility would clearly be high.
