Average true range gives the historical price range of a stock or the volatility of a stock plotted in a time range to get the average range of the price of a share. (Default 14).
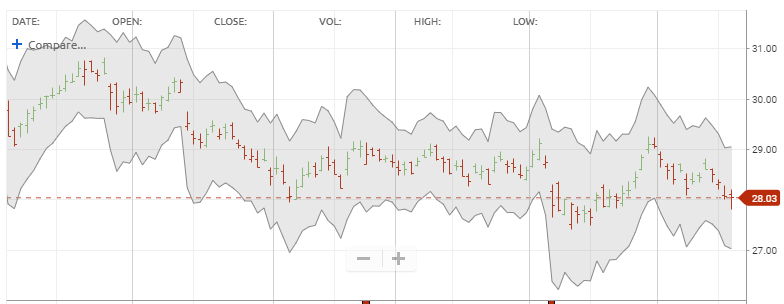
ATR Bands are an add-on of the ATR Indicator. A band is plotted around ATR to determine if the price is in an uptrend, downtrend or moving in a sideways pattern.
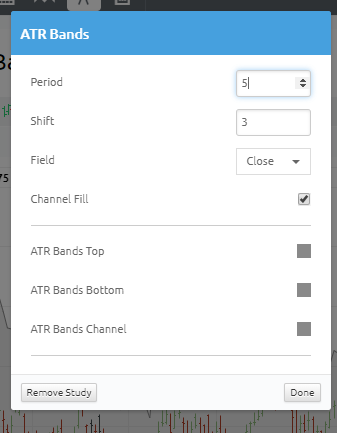
Period: Default 5 day ATR period average.
Shift: Default ATR multiple of 3 (bands above and below the ATR line)
The indicator calculates the upper price range and lower price range. Can be used as a substitue to bollinger bands.