See below for full-list of available view items in the Watchlist tool:
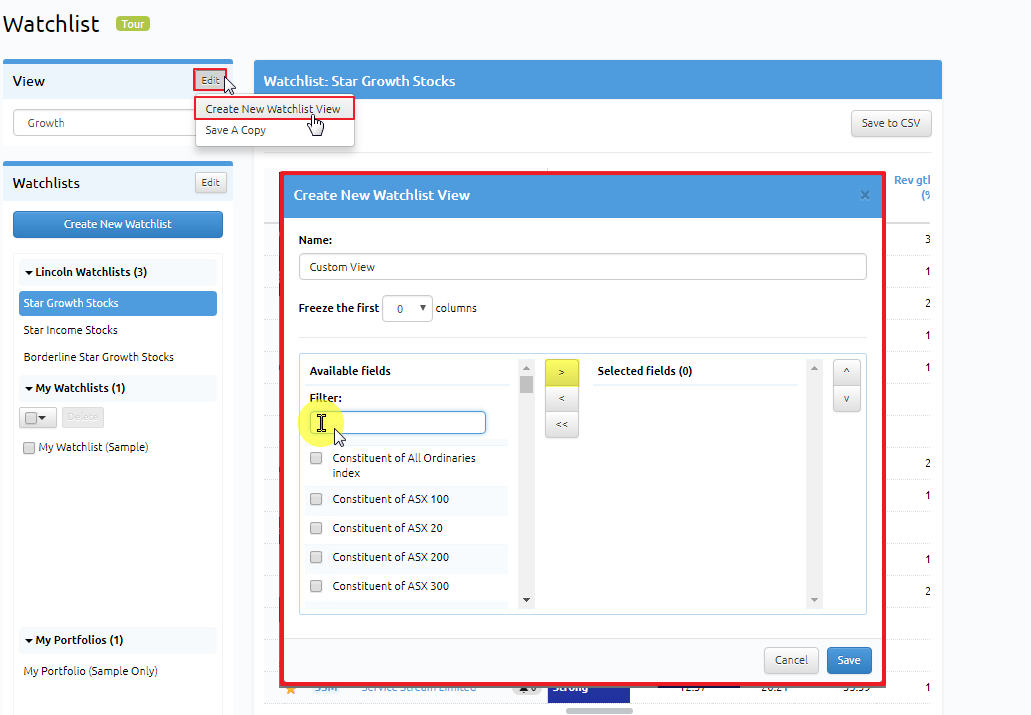
** Remember to use the filter box at the top of the watchlist view builder to find the relevant criteria quickly.
Watchlist View items
| Display Name | Abbreviated Name |
| No. of consensus analysts | Analysts |
| GICS Sector (Level 1) | GICS Sector (Lvl 1) |
| GICS Industry Group (Level 2) | GICS Ind Group (Lvl 2) |
| GICS Industry (Level 3) | GICS Ind (Lvl 3) |
| GICS Sub Industry (Level 4) | GICS Sub Ind (Lvl 4) |
| Trading Status | Trading Status |
| Star Stock Status | Star Stock Status |
| Star Stock In Price ($) (Growth) | Star In Price ($) (Growth) |
| Star Stock In Date (Growth) | Star In Date (Growth) |
| Star Stock Total Return (%) (Growth) | Star TR (%) (Growth) |
| Price Change 1 yr cf. All Ordinaries (%) | Price Chg cf. All Ords 1yr (%) |
| Price Change 1 yr cf. ASX 100 (%) | Price Chg cf. ASX 100 1yr (%) |
| Constituent of ASX 100 | ASX 100 const |
| Constituent of ASX 20 | ASX 20 const |
| Constituent of ASX 200 | ASX 200 const |
| Constituent of ASX 300 | ASX 300 const |
| Constituent of ASX 50 | ASX 50 const |
| Constituent of ASX All Australian 200 | ASX All Aust 200 const |
| Constituent of ASX All Australian 50 | ASX All Aust 50 const |
| Constituent of ASX Mid Small | ASX Mid Small const |
| Constituent of ASX MidCap 50 | ASX MidCap 50 const |
| Constituent of ASX Small Ordinaries | ASX Small Ords const |
| Constituent of All Ordinaries Index | All Ords Index const |
| Price Change 1 yr cf. ASX 20 (%) | Price Chg cf. ASX 20 1yr (%) |
| Price Change 1 yr cf. ASX 200 (%) | Price Chg cf. ASX 200 1yr (%) |
| Price Change 1 yr cf. ASX 200 Industrials (%) | Price Chg cf. ASX 200 Ind 1yr (%) |
| Price Change 1 yr cf. ASX 100 Resources (%) | Price Chg cf. ASX 200 Res 1yr (%) |
| Price Change 1 yr cf. ASX 300 (%) | Price Chg cf. ASX 300 1yr (%) |
| Price Change 1 yr cf. ASX 50 (%) | Price Chg cf. ASX 50 1yr (%) |
| Price Change 1 yr cf. ASX Small Ords (%) | Price Chg cf. ASX Small Ords 1yr (%) |
| Return Incl. Divs 1 yr cf. All Ordinaries (%) | Return cf. All Ords 1yr (%) |
| Return Incl. Divs 1 yr cf. ASX 100 (%) | Return cf. ASX 100 1yr (%) |
| Return Incl. Divs 1 yr cf. ASX 20 (%) | Return cf. ASX 20 1yr (%) |
| Return Incl. Divs 1 yr cf. ASX 200 (%) | Return cf. ASX 200 1yr (%) |
| Return Incl. Divs 1 yr cf. ASX 200 Industrials (%) | Return cf. ASX 200 Ind 1yr (%) |
| Return Incl. Divs 1 yr cf. ASX 200 Resources (%) | Return cf. ASX 200 Res 1yr (%) |
| Return Incl. Divs 1 yr cf. ASX 300 (%) | Return cf. ASX 300 1yr (%) |
| Return Incl. Divs 1 yr cf. ASX 50 (%) | Return cf. ASX 50 1yr (%) |
| Return Incl. Divs 1 yr cf. ASX Small Ords (%) | Return cf. ASX Small Ords 1yr (%) |
| Financials Received | Financials Received |
| Forecast Year 1 Period End | Fcst yr 1 Period End |
| Forecast Year 2 Period End | Fcst yr 2 Period End |
| Last Price Sensitive Announcement | Price Senstive A'ment |
| Period End | Period End |
| Average Daily Trade ($000) | Avg Trade ($000) |
| Average Daily Volume | Avg Vol |
| Diluted Weighted Average Shares (M) | Weighted Avg Shares (M) |
| Enterprise Value ($M) | Enterprise Value ($M) |
| Diluted Weighted Average Shares (M) Forecast yr1 | Fcst Wgt Avg Shares (M) yr1 |
| Diluted Weighted Average Shares (M) Forecast yr2 | Fcst Wgt Avg Shares (M) yr2 |
| Last Daily Trade ($000) | Last Daily Trade ($000) |
| Last Volume | Last Vol |
| Last Volume to Average Daily Volume (%) | Last Vol to Avg Vol (%) |
| Market Capitalisation ($M) | Market Cap ($M) |
| Shares Outstanding (M) | Shares Outstanding (M) |
| Financial Health Score | Financial Health Score |
| Financial Health Rating | Financial Health Rating |
| Financial Health Trend | Financial Health Trend |
| Industry Model | Industry Model |
| CATAI | CATAI |
| CATAI Rating | CATAI Rating |
| CBTA | CBTA |
| CBTA Rating | CBTA Rating |
| CBTL | CBTL |
| CBTL Rating | CBTL Rating |
| CLTL | CLTL |
| CLTL Rating | CLTL Rating |
| CTCCL | CTCCL |
| CTCCL Rating | CTCCL Rating |
| OCFCL | OCFCL |
| OCFCL Rating | OCFCL Rating |
| OCFTAI | OCFTAI |
| OCFTAI Rating | OCFTAI Rating |
| PDACL | PDACL |
| PDACL Rating | PDACL Rating |
| QACA | QACA |
| QACA Rating | QACA Rating |
| QLCL | QLCL |
| QLCL Rating | QLCL Rating |
| RPTAI | RPTAI |
| RPTAI Rating | RPTAI Rating |
| TLTAI | TLTAI |
| TLTAI Rating | TLTAI Rating |
| 52-Week High Price ($) | 52-Week High ($) |
| 52-Week Low Price ($) | 52-Week Low ($) |
| Consensus Price Target ($) | Consensus Tgt ($) |
| Consensus Price Target Date | Consensus Tgt Date |
| Price Change 1 Day ($) | Price Chg 1day ($) |
| Price Change 1 Day (%) | Price Chg 1day (%) |
| Price Change 1 Week (%) | Price Chg 1wk (%) |
| Price Change 1 Month (%) | Price Chg 1mth (%) |
| Price Change 3 Months (%) | Price Chg 3mth (%) |
| Price Change 6 Months (%) | Price Chg 6mth (%) |
| Price Change 1 Year (%) | Price Chg 1yr (%) |
| Price Change 3 Years (%) | Price Chg 3yr (%) |
| Price Change 5 Years (%) | Price Chg 5yr (%) |
| Price to Consensus Target (%) | Price to Cons Tgt (%) |
| Return 1 yr Including Dividends (%) | Return 1yr Incl Div (%) |
| Return 3 yr Including Dividends (% pa) | Return 3yr Incl Div (% pa) |
| Return 5 yr Including Dividends (% pa) | Return 5yr Incl Div (% pa) |
| Share Price ($) | Share Price ($) |
| Assets: Current Total ($) | Assets: Current ($) |
| Assets: Non-Current Total ($) | Assets: Non-Current ($) |
| Assets: Total ($) | Assets ($) |
| Cash Flow: Cash at beginning ($) | CF: Cash at Start ($) |
| Cash Flow: Cash at End ($) | CF: Cash at End ($) |
| Cash Flow: Net Increase in Cash ($) | CF: Net Incr in Cash ($) |
| Cash Flows: Net Financing ($) | CF: Net Financing ($) |
| Cash Flows: Net Investing ($) | CF: Net Investing ($) |
| Cash Flows: Net Operating ($) | CF: Net Operating ($) |
| EBIT ($) | EBIT ($) |
| EPS After Abnormals (cents) | EPS After Abnormals (c) |
| EPS Before Abnormals (cents) | EPS Bef Abnormals (c) |
| Equity: Total ($) | Equity ($) |
| Liabilities: Current Total ($) | Liab: Current ($) |
| Liabilities: Non-Current Total ($) | Liab: Non-Current ($) |
| Liabilities: Total ($) | Liab ($) |
| NPAT Before Abnormals ($) | NPAT Bef Abnormals ($) |
| Profit Before Tax & Abnormals ($) | Profit Bef Tax & Abnormals ($) |
| Revenue: Total (Excluding Interest) ($) | Revenue ($) |
| Cash Flow per Share (cents) | CFPS (¢) |
| Cash Flow per Share (cents) Forecast Year 1 | CFPS (¢) Fcst yr1 |
| Cash Flow per Share (cents) Forecast Year 2 | CFPS (¢) Fcst yr2 |
| Net Debt to Equity | Net Debt to Equity |
| EPS Before Abnormals (cents) Forecast yr 1 | EPS (¢) Fcst yr1 |
| EPS Before Abnormals (cents) Forecast yr 2 | EPS (¢) Fcst yr2 |
| EV/EBITDA | EV/EBITDA |
| Interest Coverage Ratio | Interest Coverage |
| NTA per Share ($) | NTA per Share ($) |
| PE (Price Earnings) Ratio | PE |
| PE Ratio Forecast Year 1 | PE Fcst yr1 |
| PE Ratio Forecast Year 2 | PE Fcst yr2 |
| PEG (Price Earnings Growth) Ratio | PEG |
| PEG Ratio Forecast Year 1 | PEG Fcst yr1 |
| PEG Ratio Forecast Year 2 | PEG Fcst yr2 |
| Price to CashFlow | Price to CashFlow |
| Price to CashFlow Forecast Year 1 | Price to CF Fcst yr1 |
| Price to CashFlow Forecast Year 2 | Price to CF Fcst yr2 |
| Price to NTA | Price to NTA |
| Price to Sales | Price to Sales |
| Price to Sales Forecast Year 1 | Price to Sales Fcst yr1 |
| Price to Sales Forecast Year 2 | Price to Sales Fcst yr2 |
| Net Profit Margin (%) | Net Profit Margin (%) |
| ROA % (Return on assets) | ROA (%) |
| ROA (%) Forecast Year 1 | ROA (%) Fcst yr1 |
| ROA (%) Forecast Year 2 | ROA (%) Fcst yr2 |
| ROE % (Return on equity) | ROE (%) |
| ROE (%) Forecast Year 1 | ROE (%) Fcst yr1 |
| ROE (%) Forecast Year 2 | ROE (%) Fcst yr2 |
| Sales per Share ($) | Sales per Share ($) |
| EPS (Earnings per Share) Growth 1 yr (%) | EPSG 1yr (%) |
| EPS Growth 1 yr (%) Forecast Year 1 | EPSG 1yr (%) Fcst yr1 |
| EPS Growth 1 yr (%) Forecast Year 2 | EPSG 1yr (%) Fcst yr2 |
| EPS Growth 2 yr (% pa) | EPSG 2yr (% pa) |
| EPS Growth 2 yr (% pa) Forecast Year 1 | EPSG 2yr (% pa) Fcst yr1 |
| EPS Growth 2 yr (% pa) Forecast Year 2 | EPSG 2yr (% pa) Fcst yr2 |
| Profit Bef Tax & Abs Growth 1 yr (%) | Prof Pretax Gth 1yr (%) |
| Profit Bef Tax & Abs Growth 1 yr (%) Fcst yr 1 | Prof Pretax Gth 1yr (%) Fcst yr1 |
| Profit Bef Tax & Abs Growth 1 yr (%) Fcst yr 2 | Prof Pretax Gth 1yr (%) Fcst yr2 |
| Profit Bef Tax & Abs Growth 2 yr (% pa) | Prof Pretax Gth 2yr (% pa) |
| Profit Bef Tax & Abs Growth 2 yr (% pa) Fcst yr 1 | Prof Pretax Gth 2yr (% pa) Fcst yr1 |
| Profit Bef Tax & Abs Growth 2 yr (% pa) Fcst yr 2 | Prof Pretax Gth 2yr (% pa) Fcst yr2 |
| Revenue Growth 1 yr (%) | Rev Gth 1yr (%) |
| Revenue Growth 1 yr (%) Forecast Year 1 | Rev Gth 1yr (%) Fcst yr1 |
| Revenue Growth 1 yr (%) Forecast Year 2 | Rev Gth 1yr (%) Fcst yr2 |
| Revenue Growth 2 yr (% pa) | Rev Gth 2yr (% pa) |
| Revenue Growth 2 yr (% pa) Forecast Year 1 | Rev Gth 2yr (% pa) Fcst yr1 |
| Revenue Growth 2 yr (% pa) Forecast Year 2 | Rev Gth 2yr (% pa) Fcst yr2 |
| ROA (Return on Assets) Growth 1 yr (%) | ROAG 1yr (%) |
| ROA Growth 1 yr (%) Forecast Year 1 | ROAG 1yr (%) Fcst yr1 |
| ROA Growth 1 yr (%) Forecast Year 2 | ROAG 1yr (%) Fcst yr2 |
| ROA Growth 2 yr (% pa) | ROAG 2yr (% pa) |
| ROA Growth 2 yr (% pa) Forecast Year 1 | ROAG 2yr (% pa) Fcst yr1 |
| ROA Growth 2 yr (% pa) Forecast Year 2 | ROAG 2yr (% pa) Fcst yr2 |
| ROE (Return on Equity) Growth 1 yr (%) | ROEG 1yr (%) |
| ROE Growth 1 yr (%) Forecast Year 1 | ROEG 1yr (%) Fcst yr1 |
| ROE Growth 1 yr (%) Forecast Year 2 | ROEG 1yr (%) Fcst yr2 |
| ROE Growth 2 yr (% pa) | ROEG 2yr (% pa) |
| ROE Growth 2 yr (% pa) Forecast Year 1 | ROEG 2yr (% pa) Fcst yr1 |
| ROE Growth 2 yr (% pa) Forecast Year 2 | ROEG 2yr (% pa) Fcst yr2 |
| EPS Growth 3 yr (% pa) | EPSG 3yr (% pa) |
| EPS Growth 4 yr (% pa) | EPSG 4yr (% pa) |
| Companies Composing Industry Averages | Companies in Ind Avg |
| Industry Average Dividend Yield (%) | Ind Avg DY (%) |
| Industry Average Dividend Yield (%) Forecast yr 1 | Ind Avg DY (%) Fcst yr1 |
| Industry Average Dividend Yield (%) Forecast yr 2 | Ind Avg DY (%) Fcst yr2 |
| Industry Average Gross Div. Yield (%) | Ind Avg Gross DY (%) |
| Industry Average Gross Div. Yield (%) Forecast yr 1 | Ind Avg Gross DY (%) Fcst yr1 |
| Industry Average Gross Div. Yield (%) Forecast yr 2 | Ind Avg Gross DY (%) Fcst yr2 |
| Industry Average Health Rating | Ind Avg Health Rating |
| Industry Average Health Score | Ind Avg Health Score |
| Industry Average PE Ratio | Ind Avg PE |
| Industry Average PE Ratio Forecast Year 1 | Ind Avg PE Fcst yr1 |
| Industry Average PE Ratio Forecast Year 2 | Ind Avg PE Fcst yr2 |
| Companies Composing Forecast Industry Averages | Companies in Fcst Ind Avg |
| PE to Industry Average (%) | PE to Ind Avg (%) |
| PE to Industry Average (%) Forecast Year 1 | PE to Ind Avg (%) Fcst yr1 |
| PE to Industry Average (%) Forecast Year 2 | PE to Ind Avg (%) Fcst yr2 |
| Industry Average CATAI | Ind Avg CATAI |
| Industry Average CBTA | Ind Avg CBTA |
| Industry Average CBTL | Ind Avg CBTL |
| Industry Average CLTL | Ind Avg CLTL |
| Industry Average CTCCL | Ind Avg CTCCL |
| Industry Average OCFCL | Ind Avg OCFCL |
| Industry Average OCFTAI | Ind Avg OCFTAI |
| Industry Average OCFTL | Ind Avg OCFTL |
| Industry Average PDACL | Ind Avg PDACL |
| Industry Average PITTAI | Ind Avg PITTAI |
| Industry Average QACA | Ind Avg QACA |
| Industry Average QLCL | Ind Avg QLCL |
| Industry Average RPTAI | Ind Avg RPTAI |
| Industry Average TLTA | Ind Avg TLTA |
| Industry Average TLTAI | Ind Avg TLTAI |
| Days to Next Ex-Dividend Date | Days to Ex-Div |
| Dividend Cover Ratio | Div Cover |
| Dividend Cover Ratio Forecast Year 1 | Div Cover Fcst yr1 |
| Dividend Cover Ratio Forecast Year 2 | Div Cover Fcst yr2 |
| Dividend Yield (%) | Div Yield (%) |
| Dividend Yield (%) Forecast Year 1 | Div Yield (%) Fcst yr1 |
| Dividend Yield (%) Forecast Year 2 | Div Yield (%) Fcst yr2 |
| DPS (Dividend per Share) Growth 1 yr (%) | DPS Gth 1yr (%) |
| DPS Growth 1 yr (%) Forecast Year 1 | DPS Gth 1yr (%) Fcst yr1 |
| DPS Growth 1 yr (%) Forecast Year 2 | DPS Gth 1yr (%) Fcst yr2 |
| DPS Growth 2 yr (%) | DPS Gth 2yr (%) |
| DPS Growth 2 yr (%) Forecast Year 1 | DPS Gth 2yr (%) Fcst yr1 |
| DPS Growth 2 yr (%) Forecast Year 2 | DPS Gth 2yr (%) Fcst yr2 |
| Annualised DPS (cents) Forecast Year 1 | DPS (c) Fcst yr1 |
| Annualised DPS (cents) Forecast Year 2 | DPS (c) Fcst yr2 |
| Annualised DPS (cents) | DPS (c) |
| Ex-Dividend Date | Ex-Div Date |
| Year Average Franking (%) | Franking (%) |
| Gross Dividend Yield (%) | Gross DY (%) |
| Gross Dividend Yield (%) Forecast Year 1 | Gross DY (%) Fcst yr1 |
| Gross Dividend Yield (%) Forecast Year 2 | Gross DY (%) Fcst yr2 |
| Annualised Gross DPS (cents) Forecast Year 1 | Gross DPS (¢) Fcst yr1 |
| Annualised Gross DPS (cents) Forecast Year 2 | Gross DPS (¢) Fcst yr2 |
| Annualised Gross DPS (cents) | Gross DPS (¢) |
| Market Gross Dividend Yield (%) | Mkt Gross DY (%) |
| Market Gross Dividend Yield (%) Forecast Year 1 | Mkt Gross DY (%) Fcst yr1 |
| Next DPS (cents) | Next DPS (c) |
| Next Ex-Dividend Date | Next Ex-div Date |
| Next Franking (%) | Next Franking (%) |
| Annualised Special DPS (cents) | Special DPS (¢) |
| Enterprise Value per Share | EV per Share |
| EBITDA | EBITDA |
| Gross Profit Margin (%) | Gross Profit Margin (%) |
| Gross Profit Margin (%) Forecast Year 1 | Gross Profit Margin (%) Fcst yr1 |
| Gross Profit Margin (%) Forecast Year 2 | Gross Profit Margin (%) Fcst yr2 |
| Last Analyst Comments | Last Analyst Comments |
| Dividend Payout Ratio (%) | Div Payout (%) |
| Dividend Payout Ratio (%) Forecast Year 1 | Div Payout (%) Fcst yr 1 |
| Dividend Payout Ratio (%) Forecast Year 2 | Div Payout (%) Fcst yr 2 |
| Earnings Yield (%) | Earnings Yield (%) |
| Star Stock Out Date (Growth) | Star Out Date (Growth) |
| Star Stock In Date (Income) | Star In Date (Income) |
| Star Stock Out Date (Income) | Star Out Date (Income) |
| Star Stock In Price ($) (Income) | Star In Price ($) (Income) |
| Star Stock Total Return (%) (Income) | Star TR (%) (Income) |
| Star Stock In Date (Growth) | Star In Date (Growth) |
| Star Stock Out Date (Growth) | Star Out Date (Growth) |
| Star Stock In Price ($) (Growth) | Star In Price ($) (Growth) |
| Star Stock Total Return (%) (Growth) | Star TR (%) (Growth) |
| Last Journal Entry | Last Journal |
| SDMAX Status | SDMAX Status |
| SD30TSR Status | SD30TSR Status |
| Accruals (%) | Accruals (%) |
| CEO/MD + Chairman holding ($) | CEO/MD + Chairman holding ($) |
| Earnings Quality | Earnings Quality |
| Free Cash Flow per Share (¢) | Free CFPS (¢) |
| Free Cash Flow per Share (¢) Forecast Year 1 | Free CFPS (¢) Fcst Yr1 |
| Free Cash Flow per Share (¢) Forecast Year 2 | Free CFPS (¢) Fcst Yr2 |
| Gross Dividend Yield to Market Average (%) | GDY to Mkt Avg (%) |
| Market Average PE Ratio | Mkt Avg PE |
| Market Average PE Ratio Forecast Year 1 | Mkt Avg PE Fcst Yr1 |
| Market Average PE Ratio Forecast Year 2 | Mkt Avg PE Fcst Yr2 |
| Net Debt to EBITDA | Net Debt to EBITDA |
| Next Report | Next Report |
| Operating Cash Flow per Share (¢) | Operating CFPS (¢) |
| Operating Cash Flow per Share (¢) Forecast Year 1 | Op. CFPS Fcst Yr1 (¢) |
| Operating Cash Flow per Share (¢) Forecast Year 2 | Op. CFPS Fcst Yr2 (¢) |
| ROIC % (Return on Invested Capital) | ROIC (%) |
| ROIC (%) Forecast Year 1 | ROIC (%) Fcst Yr1 |
| ROIC (%) Forecast Year 2 | ROIC (%) Fcst Yr2 |
| PE to Market Average (%) | PE to Mkt Avg (%) |
| PE to Market Average (%) Forecast Year 1 | PE to Mkt Avg (%) Fcst Yr1 |
| PE to Market Average (%) Forecast Year 2 | PE to Mkt Avg (%) Fcst Yr2 |
| Price to Total Revenue | Price to Revenue |
| Price to Total Revenue Forecast Year 1 | Price to Revenue Fcst Yr1 |
| Price to Total Revenue Forecast Year 2 | Price to Revenue Fcst Yr2 |
| ROIC Growth 1 yr (%) | ROICG 1yr (%) |
| ROIC Growth 1 yr (%) Forecast Year 1 | ROICG 1yr (%) Fcst Yr1 |
| ROIC Growth 1 yr (%) Forecast Year 2 | ROICG 1yr (%) Fcst Yr2 |
| ROIC Growth 2 yr (%) | ROICG 2yr (%) |
| ROIC Growth 2 yr (%) Forecast Year 1 | ROICG 2yr (%) Fcst Yr1 |
| ROIC Growth 2 yr (%) Forecast Year 2 | ROICG 2yr (%) Fcst Yr2 |
| All Directors' Holding ($) | All Director's Holding ($) |
| EPS Forecast Year 1 3M Revision | EPS Fcst yr1 3M Rev |
| Intangibles to Total Assets (%) | Intang. to TA |