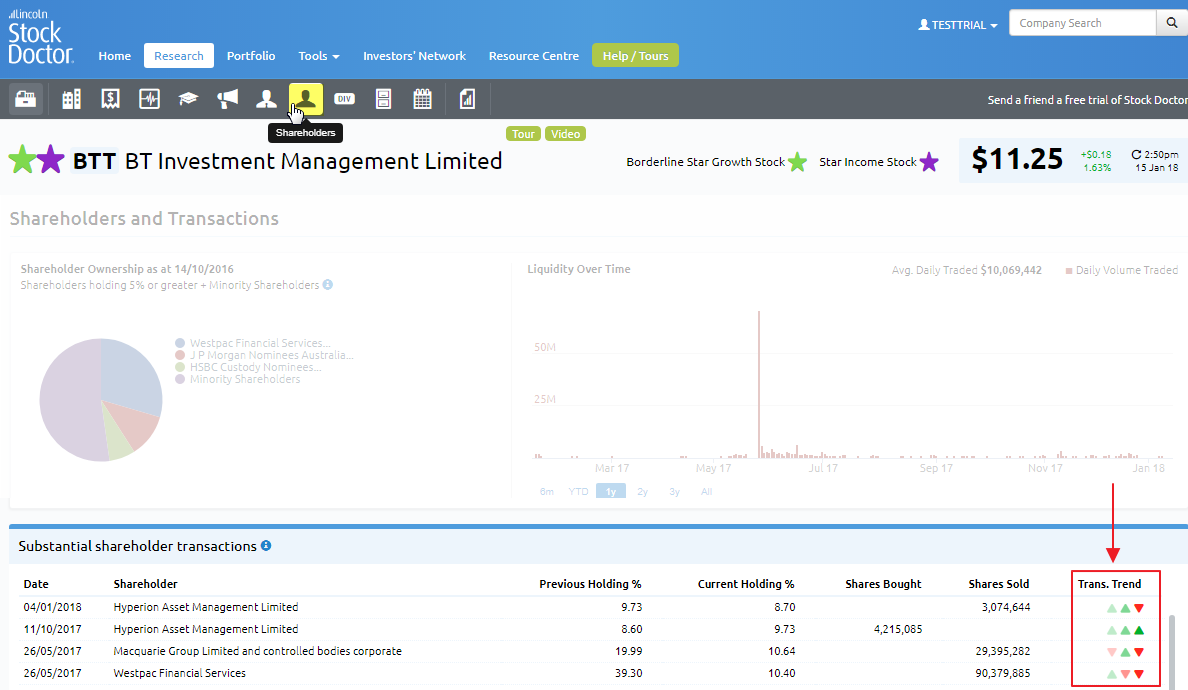
The arrows indicate the substantial shareholder's recent purchases or sells.
The three arrows reflect the three most recent transactions with the bold arrow being the most recent trade and the faded arrow represents the oldest of the three.
This secondary information can used by investors to see whether substantial shareholders in the company have been recently increasing or decreasing their holding within the company.
Examples:
This pattern shows the last three transactions of the major shareholder have been buys
This pattern shows the last three transactions of the major shareholders have been sells
This pattern shows that the most recent transaction by the major shareholder was to buy more shares. However prior to that the previous two transactions were sells