In this section, you’ll get access to the data from the Financial Statements of a company, after analysis from the Research team. 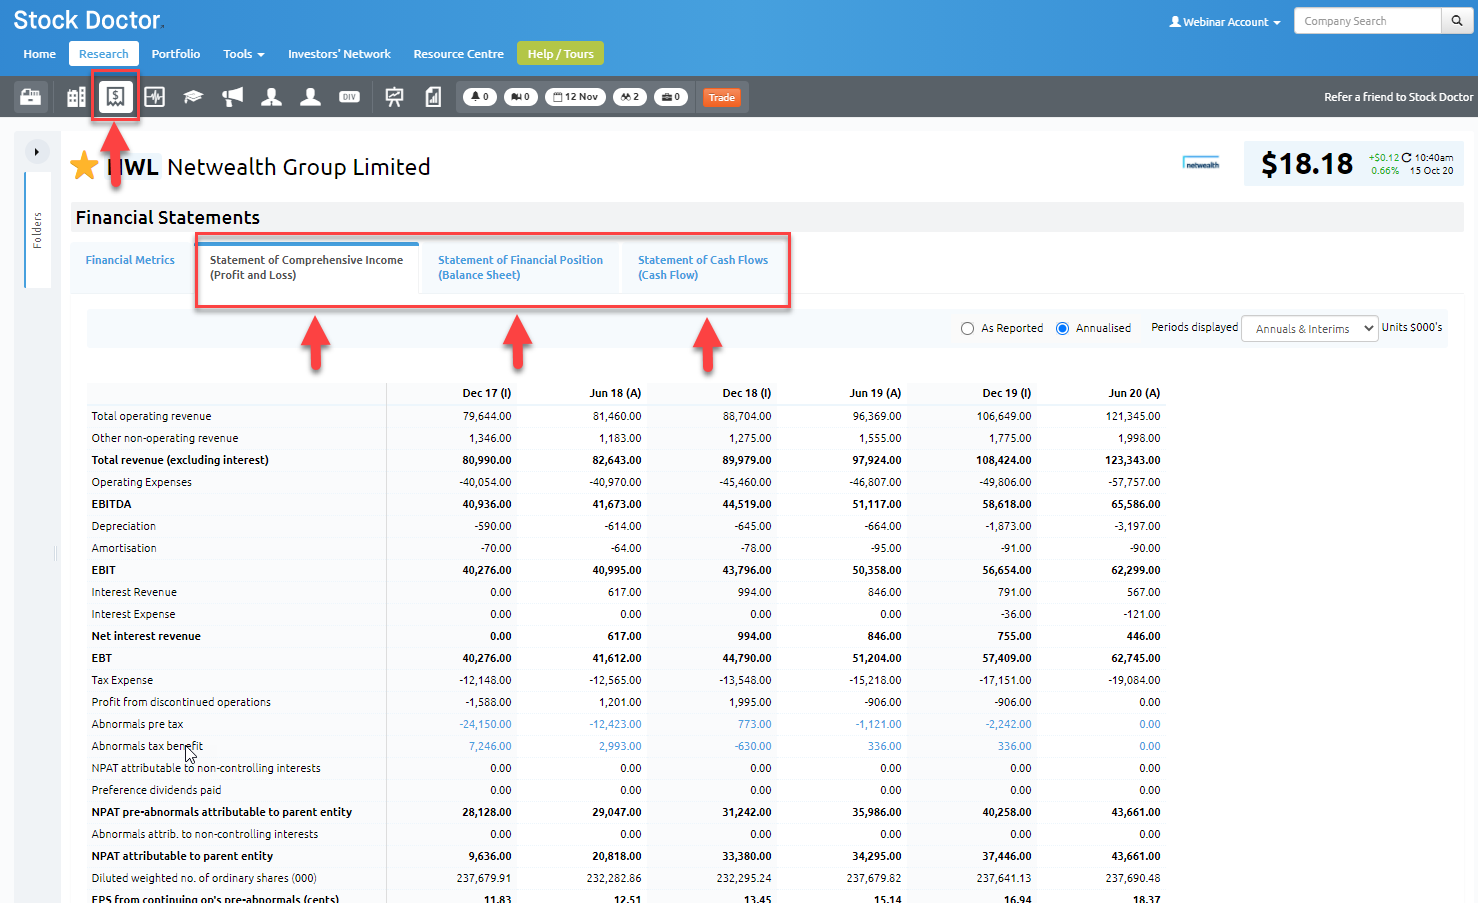
You’ll see the main statements issued by a company:
- Statement of comprehensive income (commonly referred to as a Profit and loss statement)
- Statement of financial position (commonly referred to as a Balance sheet)
- Statement of cash flows (aka cash flow statement)
You’ll also be able to view the Company Summary screen for those users who were familiar with the Stock Doctor PC version.
You can access this information by clicking on the tabs at the top of the screen.
You also have the option to see the financial information either ‘As Reported’ or ‘Annualised’. The figures ‘As Reported’ are exactly as they sound: as reported straight from the source, and this will typically be from the financial statements of the companies themselves as soon as they report them.
‘Annualised’ figures is a method we apply to the raw, or as reported figures to get a true rolling 12 month assessment of a company’s financial performance. Annualised growth rates are the rates used to determine whether a company’s financial performance satisfies return metrics.
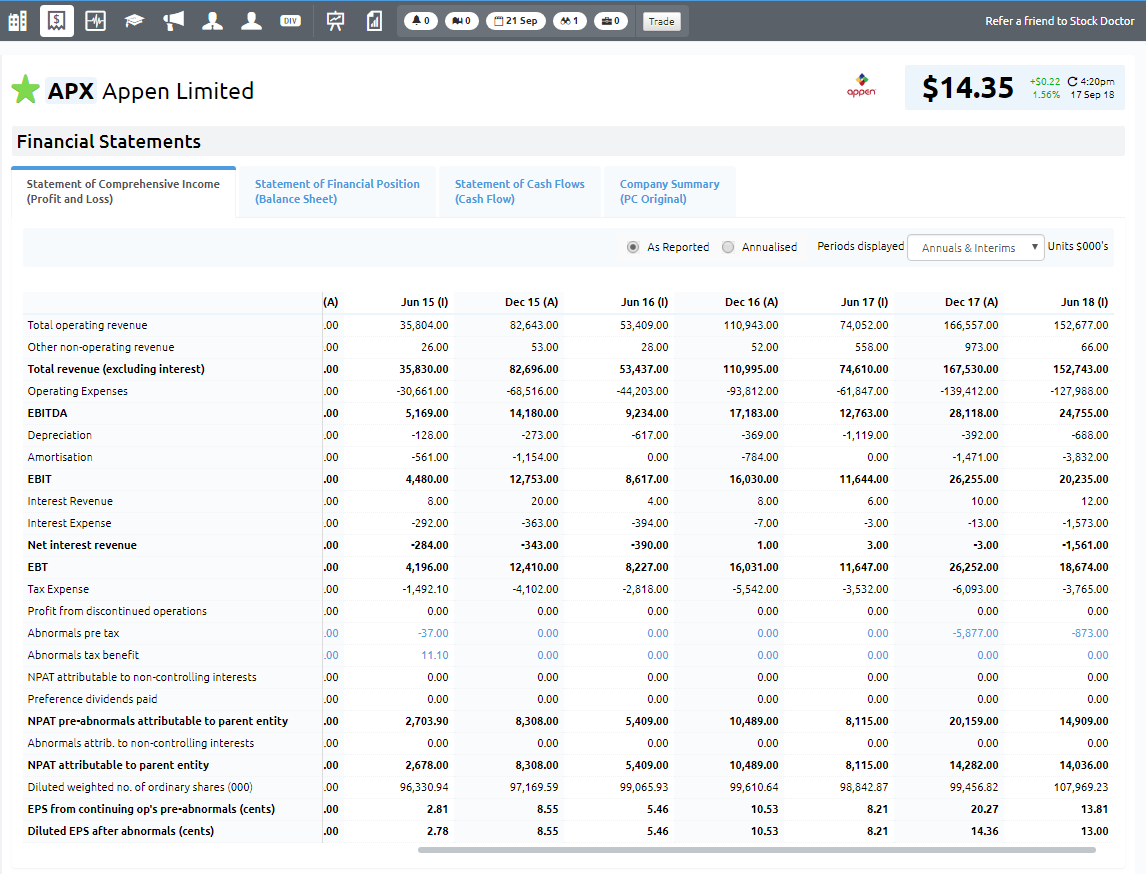
Profit and Loss statement
You can assess the profitability of the company, and go back through history to see the company’s record of earning profit for shareholders.
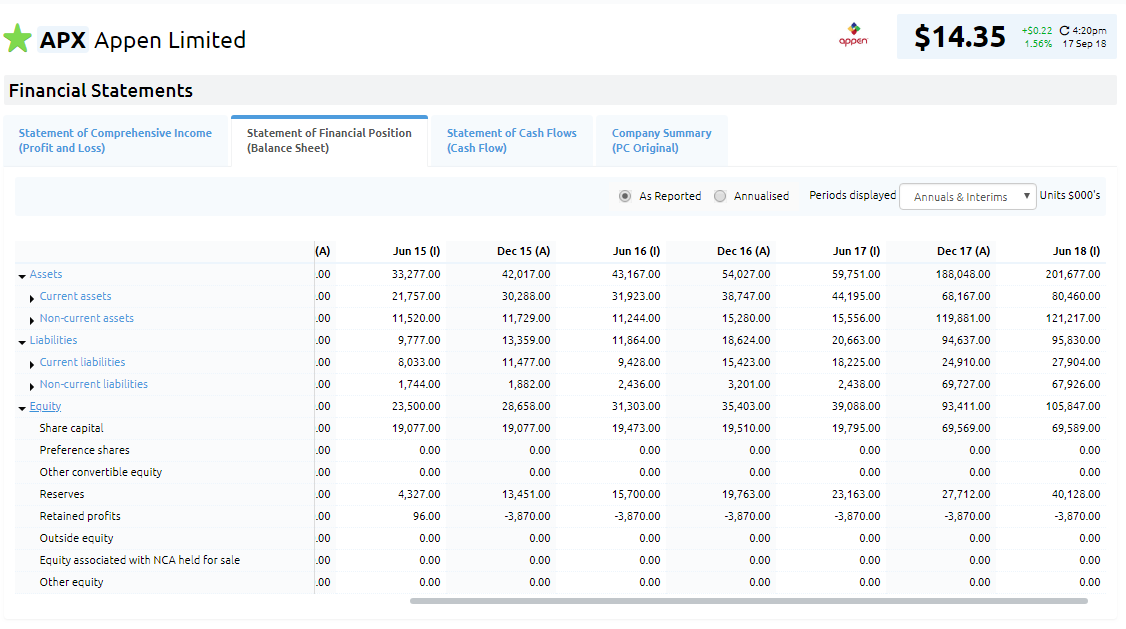
Balance Sheet
Click on the headings: Assets, Liabilities or Net Assets to drill down further in a company’s balance sheet. Use the scroll at the bottom of the main window to research older balance sheets.
You can keep clicking down on subheadings to get even more granular detail of the balance sheet.
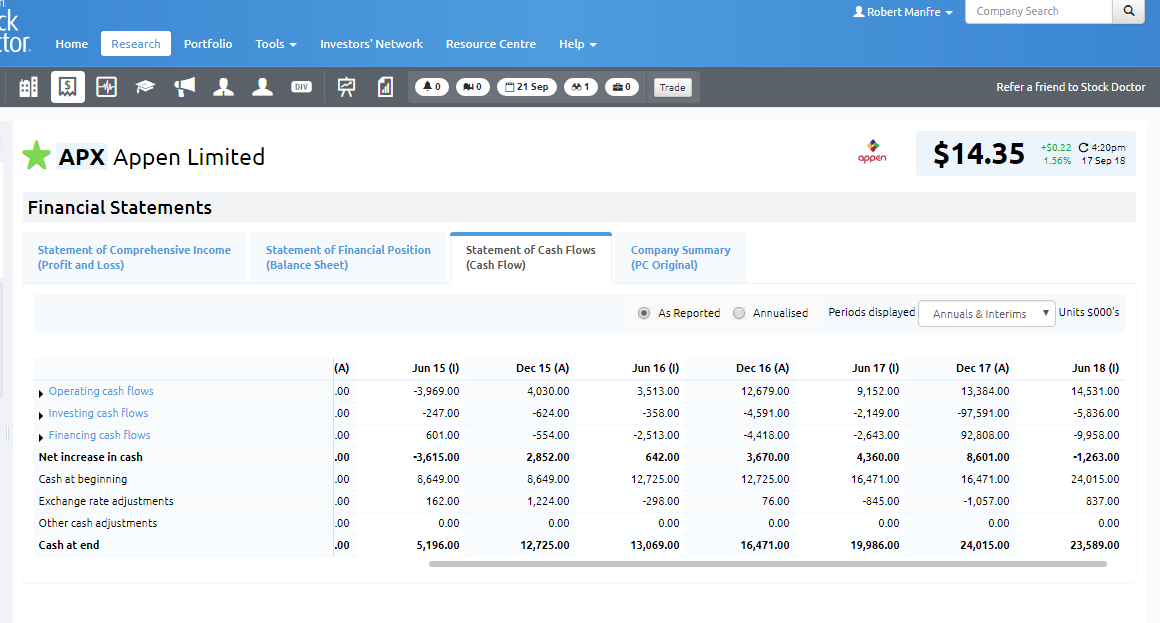
Statement of Cash Flows
The information in this financial statement is usually separated into three sections, as well as a summary of the flow of cash during the period, and a high level reconciliation of the cash at the beginning of the period to the end of the period.