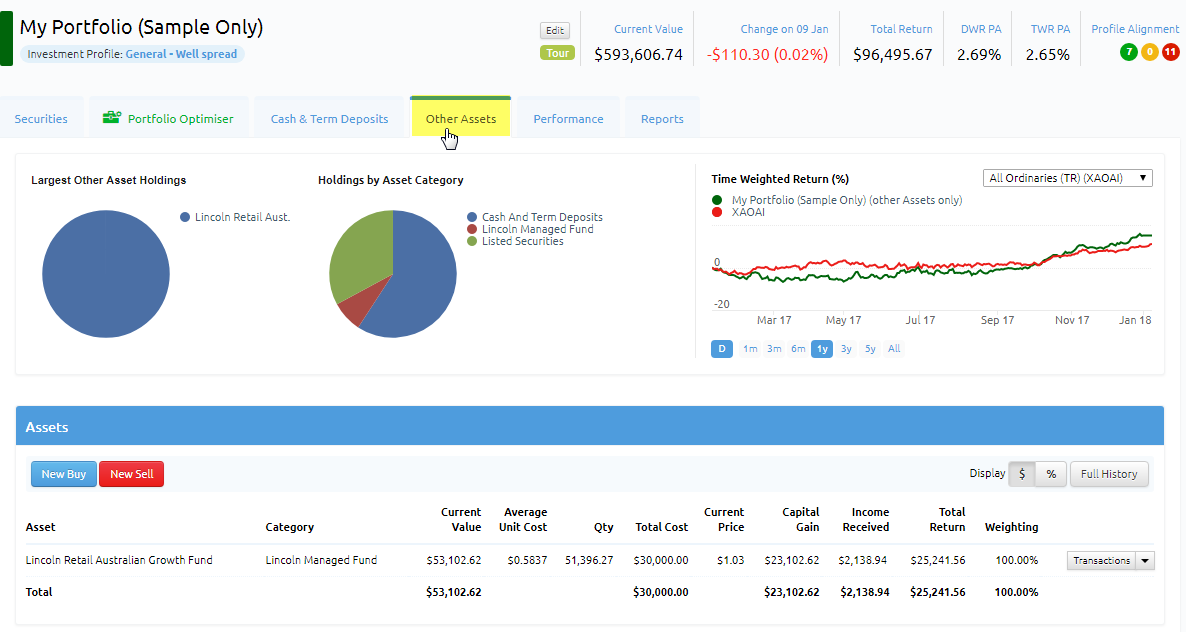
The 'Other Assets' section of the portfolio manager, allows investors to add assets that are not ASX listed securities such as funds, property, hybrids, cash accounts into a selected portfolio.

At the top left of the 'Other Assets' screen in Portfolio Manager, investors will be able to see both the Largest Asset Holdings within a specific portfolio and also a split of the portfolio Asset Holdings by Asset Category. To the right of this, investors are able to the performance of the portfolio compared to various ASX indices.
This index shown is automatically the All Ords Accumulation Index (XAOAI), however, to change this there is a drop-down menu in the top right hand corner. The time-frame shown for the performance is automatically set at one year, however, investors can also change this to a shorter or longer period by selecting this below the chart. In addition, investors can select whether to see daily (D) or monthly (M) price movements. Under the chart, investors are able to quickly add a new transactions by clicking on the 'New Buy' button.
Valuations
Then you can add the asset unit price history using the Valuations section by clicking “New valuation”

Assets Held
In the Assets Held section, all of the current Asset Holdings within a specific portfolio are shown. The Assets will be sorted alphabetically by Code. Immediately to the right of the asset, investors can quickly enter a sell or other transactions relating to that asset by clicking on the sell or dropdown arrow button. In the next columns, investors can view the Buy Date, Category, Quantity, Average Unit Price, Total Cost, Current Value, Average Buy Price, Total Cost and Current Value. Further to the right, users can see the Capital Gain ($). This information can either be viewed as a percentage or in dollar terms (default setting) - to change the setting click on the '$' or '%' buttons in to top right hand corner of this section. To the right of these columns, investors can see the percentage Weighting of each asset in their portfolio. In the final column, we have the Status of the security.
Recent Transactions
In the Recent Transactions section, investors will have a list of the five most Recent Asset Transactions for this portfolio. The transactions will be ordered in the Date column with the most recent at the top. The Trade Type column includes the type of transaction such as Buy, Sell etc, while the Quantity and Holding Balance are shown to the right of this. If applicable Price and Fees are highlighted in the next two columns, while the last column the Value of the transaction is shown. At the top right hand corner of this section, investors can click on the 'View Report' button. This will enable users to filter transactions by date ranges and then either save to CSV, save to PDF or print the report with the relevant information.
Recent Income And Expenses
The Recent Income section, highlights recent relevant asset Income and Expenses for this portfolio. The income will also be ordered in the Date column with the most recent at the top. The other columns provided information of the Holding, Franking(%), Franked amount, Unfranked amount, Total received, Franking Credit and Total Taxable. At the top right hand corner of this section, investors can click on the 'View Report' button. This will enable users to filter transactions by date ranges and then either save to CSV, save to PDF or print the report with the relevant information.